The Research of Effective PWM Noise Reduction Methods for EV PTC Heater
Copyright Ⓒ 2024 KSAE / 226-01
This is an Open-Access article distributed under the terms of the Creative Commons Attribution Non-Commercial License(http://creativecommons.org/licenses/by-nc/3.0) which permits unrestricted non-commercial use, distribution, and reproduction in any medium provided the original work is properly cited.
Abstract
This paper addresses the issue of PTC heater noise in electric and hybrid vehicles. Unlike internal combustion engine cars, electric cars require a separate PTC heater for interior heating. However, this PTC heater generates noticeable noise, particularly in electric vehicles where vehicle noise is minimal during stops or idle, making passengers more sensitive. The paper explored noise reduction methods through mechanical, electrical circuits, and PTC control algorithm improvements, focusing on algorithm enhancement and circuit control gate timing adjustments. Additionally, noise was quantitatively and qualitatively evaluated. For the qualitative assessment, representative evaluators from different age groups (i.e., 20s, 30s, 40s) were involved, and FFT analysis confirmed the precise frequency band of noise reduction.
Keywords:
PTC heater, Switching noise, Switching loss, Noise analysis, HVAC noise, Noise reduction키워드:
PTC 히터, 스위칭 노이즈, 스위칭 손실, 소음 분석, HVAC 소음, 소음저감1. Introduction
With the proliferation of electric and hybrid vehicles, the lineup available to users has expanded from low-cost electric cars to high-end models. Unlike internal combustion engine vehicles that utilize engine waste heat for heating, electric cars require a separate PTC(Positive Temperature Coefficient) heater for interior heating.1,2) Additionally, internal combustion engine vehicles have engine noise, making passengers less sensitive to PTC operation noise. In contrast, electric and hybrid vehicles produce minimal vehicle noise during stops or idle, making passengers more susceptible to slight PTC heater operation noise. Furthermore, as vehicles become more advanced, their sound insulation performance improves, making passengers even more sensitive to PTC noise. Moreover, with a decrease in the age group purchasing luxury cars, there is a demand for PTC heaters that effectively control noise, even for younger individuals who are sensitive to noise.
Stone, a high-voltage PTC heater with BaTiO3 as its main component, efficiently converts electricity into thermal energy for interior heating. However, BaTiO3 is inherently developed for use in piezoelectric transducers.3) Piezoelectric materials convert electrical energy into mechanical energy, causing a change in shape when a voltage is applied to the PTC for heating purposes. Furthermore, to control heating capacity using Pulse Width Modulation(PWM) duty cycle adjustments,4) changes in voltage induce PTC vibration due to voltage fluctuations, leading to PTC component noise. Therefore, developing PTC heaters effectively controlled for noise is crucial for application in noise-sensitive electric vehicles.
Methods for noise improvement include enhancing the noise source to reduce noise itself, improving the path through which noise travels to inhibit transmission, and mechanically adjusting frequencies at which noise occurs to reduce resonance. Naturally, reducing the root cause of noise is the most cost-effective and efficient method. If this is not feasible, the latter method should be employed to suppress noise.
While reducing decibels(dB) is important for noise reduction, the degree of discomfort experienced by users can vary depending on various factors such as frequency and waveform, even if the measured noise is at the same dB level. Therefore, qualitative evaluation is as important as quantitative evaluation.
Noise improvement can be pursued through mechanical enhancements, electrical circuit improvements, and PTC control algorithm enhancements. Mechanical enhancements are the most costly, while circuit improvements may incur minimal or no costs, and algorithm enhancements do not incur any direct costs(excluding development costs).
This paper analyzes the causes of noise and validates the degree to which changes in gate timing of control circuits affect noise reduction, while also examining the impact of these changes on system protection functions. Finally, both quantitative noise assessment and qualitative evaluations were conducted, with evaluators from representative age groups(20s, 30s, 40s) evaluating the extent of noise reduction, and FFT analysis confirming the reduction of noise in specific frequency bands.
2. Noise Generation Mechanism
The PTC heater operates by applying a PWM signal generated by the controller to switch the switching device (such as IGBT, MOSFET, SiC, etc.), which in turn controls the BaTiO3-based PTC stone according to the applied PWM signal, turning it on and off. When PWM is applied to the PTC stone, it behaves like a piezoelectric component.
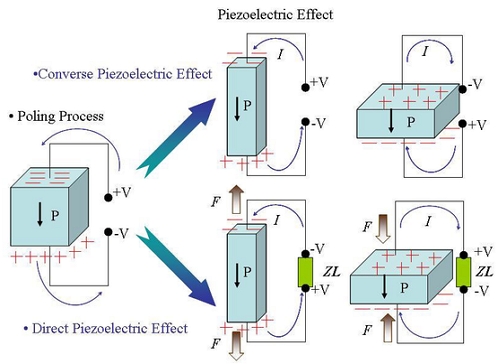
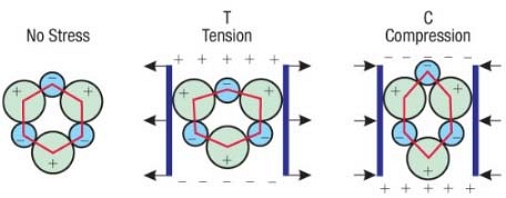
A piezoelectric component, as illustrated in Fig. 1, generates voltage when force is applied to the component, and when voltage is applied, the external shape of the component changes. As seen in Fig. 2, when force is applied to the component due to tension or pressure, the internal crystalline structure is distorted, causing a polarization phenomenon due to the relative movement of + ions and - ions. While the center of gravity of the shifted charge is automatically corrected, an electric field is formed between the two sides of the crystal. During compression and tension, the direction of the electric field also becomes opposite to each other. By connecting an electrical circuit to the component and applying external force, voltage is generated, a phenomenon known as the piezoelectric effect. Conversely, applying voltage to both sides of the component causes + ions within the electric field to move towards the negative electrode, while - ions move towards the positive electrode. As a result, depending on the direction of the applied voltage from the outside, the crystal expands or contracts, known as the inverse piezoelectric effect.5,6)
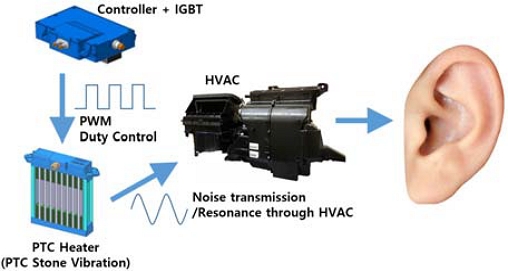
The vibration of the PTC stone caused by the reverse piezoelectric effect is transmitted to passengers through the airflow passage of the HVAC(Heating Ventilation and Air Conditioning System) or mechanical contact, and mechanical resonance may occur. Fig. 3 shows the noise generation/transmission process.7)
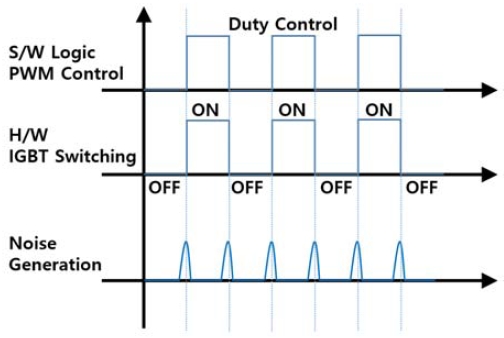
Noise occurs as depicted in Fig. 4, where software(S/W) generates the PWM signal, causing hardware(IGBT) to switch. Mechanically, noise is generated. As explained earlier, due to the characteristics of piezoelectric components, when there is no change in the applied voltage, there is no change in shape or form, resulting in no vibration or noise. However, the moment there is a change in voltage, the shape or form of the component changes, leading to vibration or noise. When the voltage variation stops and the shape or form of the component stabilizes, the sound also ceases. This means that if the rate of voltage change(dv/dt) per unit time is high, a louder sound with a higher frequency is produced, whereas if the rate of voltage change per unit time is small, the frequency range of the noise component decreases, leading to a decrease in decibels(dB) overall.
3. Noise Reduction Method
As mentioned in Chapter 1, reducing noise is more efficiently achieved by improving the noise source itself rather than simply blocking or shielding it. To achieve this, making software(S/W) or circuitry improvements incurs the least cost. Mechanically improving noise often involves significant expenses, such as adding new components or creating new molds for product shape changes. Therefore, this paper reduced noise through S/W and H/W improvements.
3.1 Noise Reduction by Reducing Frequency(S/W)
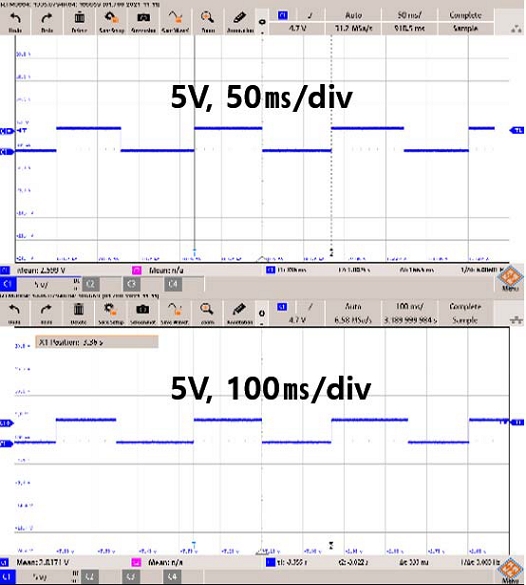
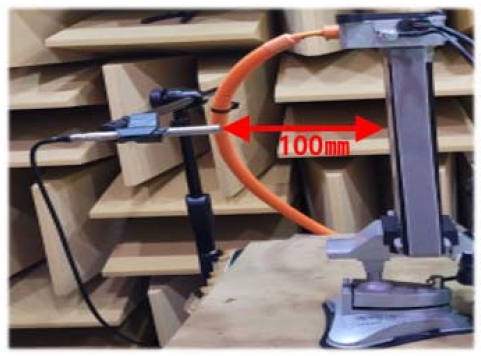
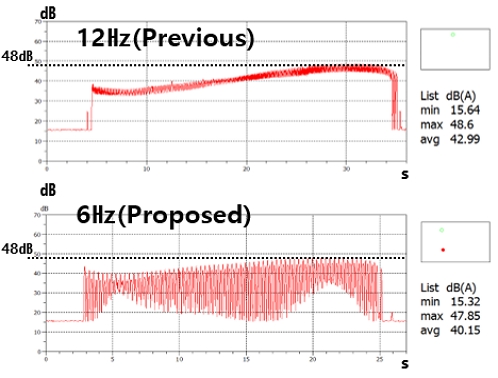
To reduce noise, there are methods to minimize the noise itself and methods to decrease the frequency of noise occurrence. However, in simple ON/OFF PWM control implemented in the software(S/W), it is not possible to directly reduce the noise itself. Therefore, as shown in Fig. 5, the driving frequency was reduced from the original 12 Hz to 6 Hz to decrease the frequency of noise occurrence. The noise was then evaluated under the conditions specified in Table 1, as depicted in Fig. 6, and the results shown in Fig. 7 were obtained. The evaluation was conducted in an anechoic chamber with a maximum background noise level of 19 dB(A).
As shown in Fig. 7, despite reducing the switching frequency from 12 Hz to 6 Hz, it can be observed that the peak noise level remains unchanged at 48 dB. However, due to the decrease in frequency, the number of noise occurrences per unit time decreases, resulting in a reduction in average noise level from 42.99 dB to 40.15 dB.
3.2 Noise R eduction b y Changing Gate Time Constant (Resistance)
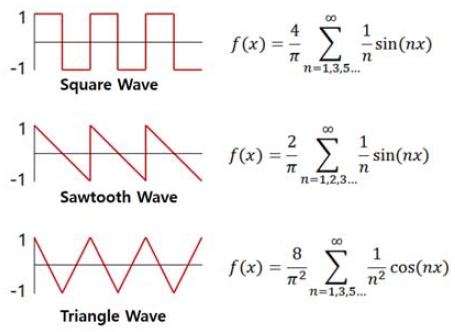
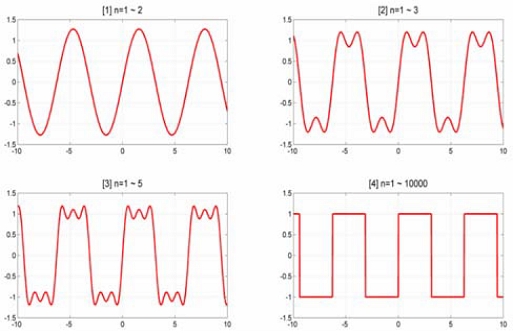
Noise waveforms can vary in several ways. They can include pure sine waves, which contain no other frequency components, as well as synthesized waveforms such as square waves and triangular waves, which are composed of odd harmonics(e.g., 1, 3, 5). Additionally, there are waveforms like sawtooth waves, which contain harmonics of all multiples(e.g., 1, 2, 3). When represented using waveform and Fourier series, they appear as depicted in Fig. 8.8) Among various noise waveforms, sine waves are perceived as least intrusive by passengers due to their fundamental nature. Therefore, whenever possible, it is desirable to create waveforms that resemble sine waves, as they are less likely to cause discomfort to passengers.9)
The PWM control waveform used in PTC heaters is a square wave, and with the driving frequency changed from the original 12 Hz to 6 Hz, it falls outside the audible frequency range of 20 Hz to 20 kHz. Consequently, the sound is not perceived as a steady tone but rather as high-frequency clicks(tic-tic) occurring only when the waveform changes, as illustrated in Fig. 4. Essentially, the sound is heard as high-frequency noises repeating at regular intervals.
To summarize, reducing the audible sound for the user entails minimizing the high-frequency components of the voltage applied to the stone, thereby reducing the rate of change(dv/dt) per unit time. Fig. 9 depicts waveforms that vary in response to changes in damping as the high-frequency components increase, as shown in Eq. (1).
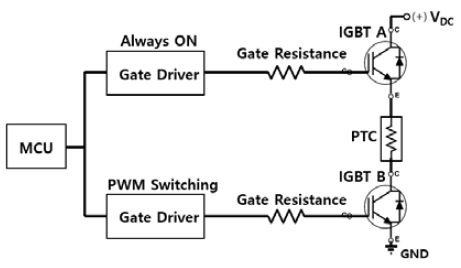
Fig. 10 depicts a simplified drive circuit and the connection between the IGBT and PTC. IGBT A operates for protection purposes and typically remains in an always-on state. IGBT B switches at 6 Hz to control the PTC using PWM. Generally, the PTC is turned on and off at a relatively slow speed, and the switching waveform becomes a square wave. By adjusting the gate resistance, it is possible to control the rate of change of the voltage applied to the PTC(dv/dt).
| (1) |
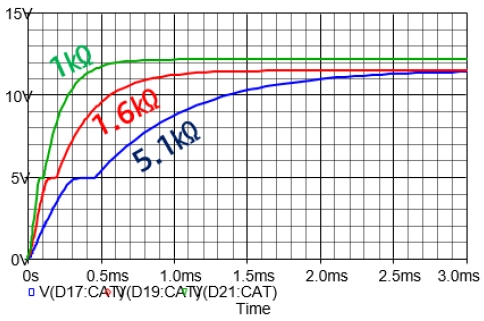
Fig. 11 illustrates the change in gate voltage according to variations in gate resistance. When the gate resistance is small, the gate voltage increases rapidly, whereas when it is large, the gate voltage increases slowly. In other words, decreasing the gate resistance increases the high-frequency components in the gate voltage, while increasing it decreases the high-frequency components.
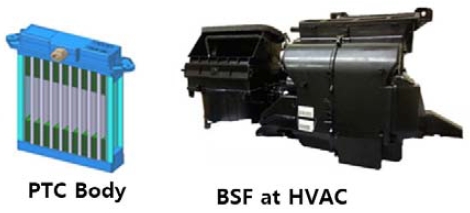
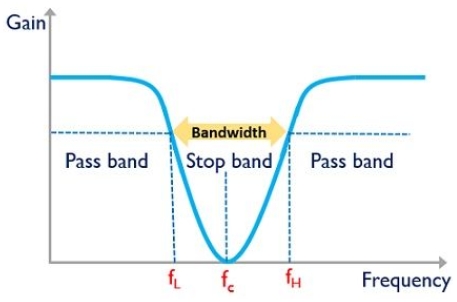
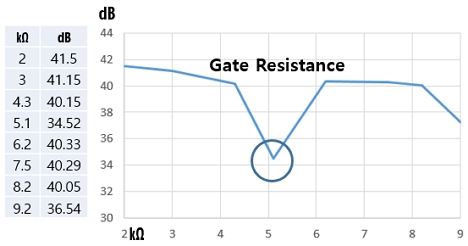
The overall trend of noise concerning gate resistance indicates that as the gate resistance increases, the high-frequency components decrease, leading to a reduction in noise. However, as depicted in Fig. 12, the combination of the PTC body and HVAC exhibits the characteristics of a Band Stop Filter(BSF), attenuating noise at specific frequencies mechanically. Fig. 13 illustrates the characteristics of the BSF, while Fig. 14 presents a graph showing the measured noise values as the resistance is varied.
Fig. 14 illustrates the average noise values measured under the conditions specified in Table 1 as the resistance varied from 2 ㏀ to 9.2 ㏀. Overall, an increase in resistance corresponds to a decrease in noise. Particularly noteworthy is the significant reduction in noise to 34.52 dB when the resistance is 5.1 ㏀.
4. Device Damage Prediction Analysis
4.1 General Switching Device Loss Calculation
To reduce noise, changes were made to the switching frequency and the gate resistance. These changes should not cause the switching device to fail when operating for extended periods in a vehicle. Therefore, an analysis of the impact of these changes on the switching device is necessary.
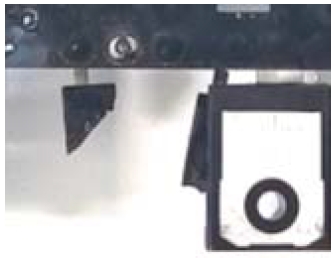
Switching components such as IGBTs, MOSFETs, and SiC devices inherently experience increased switching losses when the gate resistance is high, resulting in longer rising and falling times of voltage and current between the gate and emitter-collector. As switching losses increase, heat is generated inside the component, and internal gases may expand, leading to the possibility of component damage, as depicted in Fig. 15.
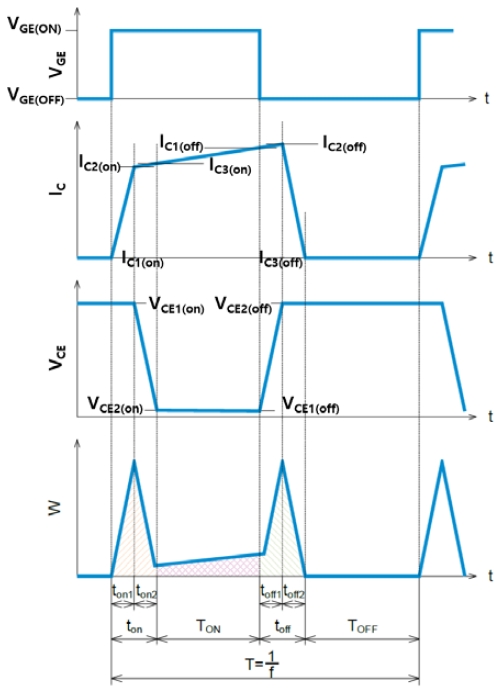
Fig. 16 schematically depicts the voltage and current across the gate, emitter, and collector of the component during switching, along with the resulting losses. These can be represented by Eqs. 2 to 5, facilitating loss calculation. Switching losses can be categorized as ON-state losses and switching losses(instantaneous losses). Switching losses can be represented by Eq. (2), while ON-state losses can be expressed by Eq. (3), and the total losses can be calculated using Eqs. (4) and (5). Although actual voltage and current exhibit exponential behavior, linear approximation is utilized for computational convenience, as it yields results close to reality with minor discrepancies.10)
| (2) |
| (3) |
| (4) |
| (5) |
4.2 PTC Switching D evice Loss Calculation
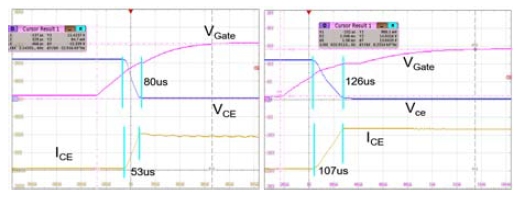
Fig. 17 shows the switching loss of 12 Hz, 2 ㏀ before improvement and the switching waveform of 6 Hz, 5.1 ㏀ after improvement, and the parameters measured through this are shown in Table 2.
By applying the parameters in Table 2 to Eqs. 2 to 5, the final loss can be obtained as shown in Table 3.
As observed in Table 3, the loss incurred per switching event increased by approximately 78 %, from 2.247 J to 3.822 J. However, as the switching frequency decreased, the loss per unit time actually decreased by 11 %, from 25.7 W to 22.9 W. This loss remains within the power dissipation characteristics specified in the component’s datasheet provided by the manufacturer, indicating no issues with usage.
5. Emotional Evaluation by Age and FFT Analysis
5.1 Emotional Evaluation by Age
Representatives within the company were selected, 1-2 people from each age group, and the process was conducted by recording scores on a score sheet. Different age groups perceive noise levels differently, and even though the decibel level may decrease, the actual reduction in discomfort when listening can vary. Therefore, representatives from each age group were selected to conduct a sensory evaluation. Table 4 presents the evaluation results, scored from 0 to 5, where 5 indicates the lowest noise level. The evaluation results align with those obtained from the noise measurement equipment, showing that the Gate Resistance of 5.1 ㏀ yielded the most superior outcome.
5.2 FFT Analysis
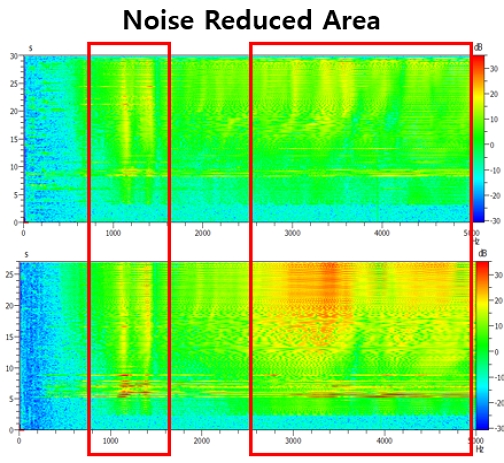
To accurately identify the specific frequency range where the noise reduction occurred with the proposed gate settings, FFT analysis was conducted on the measured noise. As a result, it was confirmed that noise decreased uniformly across the frequency range of 900 Hz to 5 kHz, as depicted in Fig. 18.
6. Conclusion
In this paper, noise reduction was achieved through mechanical improvements, electrical circuitry enhancements, and PTC control algorithm enhancements, with a particular focus on cost-free algorithm improvements and gate resistance optimization. Additionally, we verified whether the improved items affect system reliability. Both quantitative and qualitative evaluations were conducted for noise assessment. Representative evaluators from the age groups of 20s, 30s, and 40s were utilized for qualitative evaluation, and noise reduction in specific frequency bands was confirmed through FFT analysis.
Nomenclature
| RGate : | gate on resistance of IGBT, kΩ |
| Ron : | IGBT on resistance, mΩ |
| f : | PWM switching frequency, Hz |
| T : | PWM switching period, ms |
| IC : | collector current, A |
| VCE : | collector emitter voltage, V |
| WSW : | switching loss, J |
| WON : | switching device ON loss, J |
| W : | total loss, J |
| P : | total loss, W |
Acknowledgments
This paper was supported by Joongbu University Research & Development Fund, in 2023.
References
- C. H. Park, Y. J. Jee and D. W. Lee, “Development Trends of Heat-Pump System for Electric Driven Vehicles,” Auto Journal, KSAE, Vol.33, No.12, pp.29-35, 2011.
- H. M. Woo, “A Design of the DC-DC Converter for a PTC Heater of the Indoor Air Conditioning in the Electric Vehicle,” Proceedings of the Transactions of the Korean Institute of Electrical Engineers, pp.222-224, 2011.
-
M. Acosta, N. Novak, V. Rojas, S. Patel, R. Vaish, J. Koruza, G. A. Rossetti Jr. and J. Rödel, “BaTiO3-Based Piezoelectrics: Fundamentals, Current Status, and Perspectives,” Applied Physics Reviews, Vol.4, Paper No.041305, 2017.
[https://doi.org/10.1063/1.4990046]

- S. W. Jung and C. Lee, “Development of PWM Intelligent- Control High-Voltage PTC Heater for ECO- Friendly EV,” Auto Journal, KSAE, Vol.33, No.12, pp.42-46, 2011.
- Radioactivity, https://www.creationscience.com/onlinebook/Radioactivity3.html, , 2020.
- Blog Post, https://blog.naver.com/kt9411/150165849100, , 2013.
- S. W. Jung, Study on the Noise Reduction Mechanism According to PWM Control in High Voltage PTC Heater for the Electric Vehicle, M. S. Thesis, Kongju University, Gongju, 2015.
- Fourier Series Visualization, https://javalab.org/fourier_series_2/, , 2019.
- Blog Post, https://blog.naver.com/kanghans94, , 2021.
- ROHM, Calculating Power Loss in Power Device Switching Circuits, Application Note 63AN077K, 2020.
