A Study on the Application of Hollow P-EPS to a Micro-Electric Vehicle Using a Simulator
Copyright Ⓒ 2020 KSAE / 181-06
This is an Open-Access article distributed under the terms of the Creative Commons Attribution Non-Commercial License(http://creativecommons.org/licenses/by-nc/3.0) which permits unrestricted non-commercial use, distribution, and reproduction in any medium provided the original work is properly cited.
Abstract
This study focuses on a hollow-type EPS by using a high voltage micro electric vehicle. The hollow-type EPS was applied to the micro electric vehicle due to the insufficient interior space of its class. A study was conducted on the design of applying a high voltage source of an electric vehicle to the circuit, and developed a steering control logic for the micro electric vehicle. This study is the result of the verification of the high voltage source data used and the EPS of the micro electric vehicle, which is different from the existing EPS, using a simulator.
Keywords:
Hollow shaft type motor, P-EPS, High voltage ECU, Micro electric vehicle, Planetary gear1. Introduction
A long time has passed since attention shifted from fossil fuels to eco-friendly and renewable energy power sources for vehicles due to worsening environmental pollution and limited resources.
As a result, interest is growing in eco-friendly renewable energy sources such as electricity and hydrogen. As the development and use of renewable energy are gradually increasing, there is a high possibility that electricity and hydrogen will become the main energy sources in our daily lives in the near future.
In particular, the development of related technologies is more active in the automotive field. Currently, to overcome problems such as the high replacement cost of batteries due to their limited life and the decreasing subsidies for purchasing electric vehicles(EVs), many related companies are promoting battery leasing businesses and developing other various solutions both domestically and internationally.
However, innovative battery life extension technology, power loss due to voltage differences between products used in EVs, and other related technologies are still in the transitional stage and still have many problems that need to be solved.
In this study, a technology is proposed to be applied to the steering system of EVs using a high-voltage driving power source without a voltage drop.1-8)
2. Development Environment Design
This study designed a high-voltage hollow P-EPS steering system to apply battery power for driving to the target micro-electric vehicle(MEV) without a voltage drop, to achieve the steering performance goal.
2.1 Specifications of the Steering System for MEVs
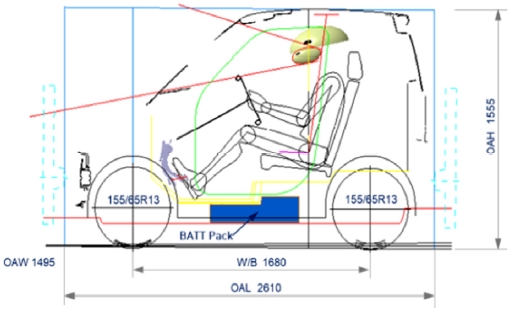
The MEV, which is the target vehicle in this study for the application of a common platform, has the following specifications:
∙ Empty vehicle weight: 600 kg
∙ Maximum power: 15 kW
∙ Battery pack: 11 kWh (144 V)
∙ Maximum speed: 80 km/h
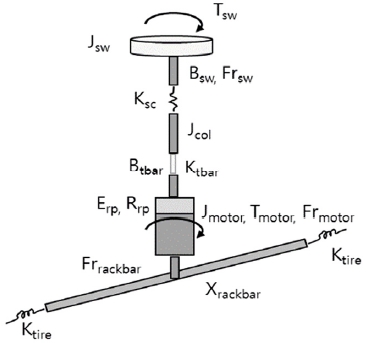
To design the P-EPS steering system in this study through mathematical modeling, the factors that can affect its performance were modeled as shown in Fig. 2.9)
| (1) |
| (2) |
| (3) |
| (4) |
Jsw : steering wheel inertia, kgm2
θsw : steering wheel angle, deg
θcol : column angle, deg
Erp : efficiency at the rack and pinion, %
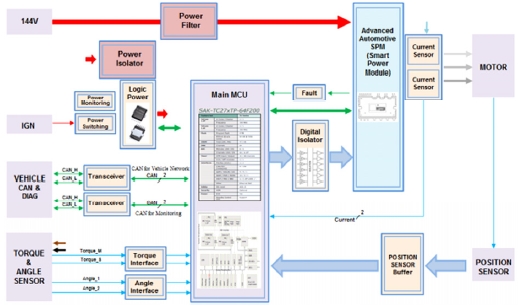
The ECU for applying the high voltage mounted in the target MEV in this study to the steering system without a voltage drop device was designed using the block diagram concept in Fig. 3.
Furthermore, since external high-voltage power sources cannot be used directly as the standby power for the internal microcontroller unit, the standby power source was test-designed using a block diagram that applies power and digital insulators.
In particular, a separate power filter and an advanced automotive smart power module(SPM) were applied to the motor input power and current for safety.
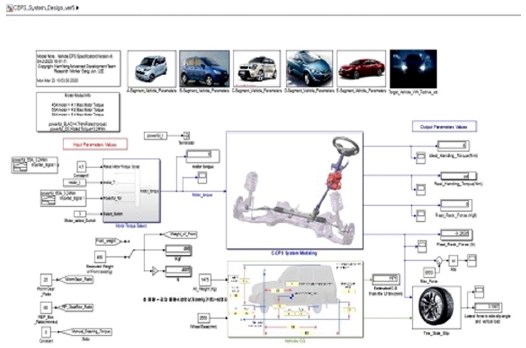
To predict the P-EPS assist output, a simulation was performed as follows. The following prediction results were derived by applying an EPS specification design software program, which was developed using the specifications of the target vehicle and the mathematical modeling design of the steering system.
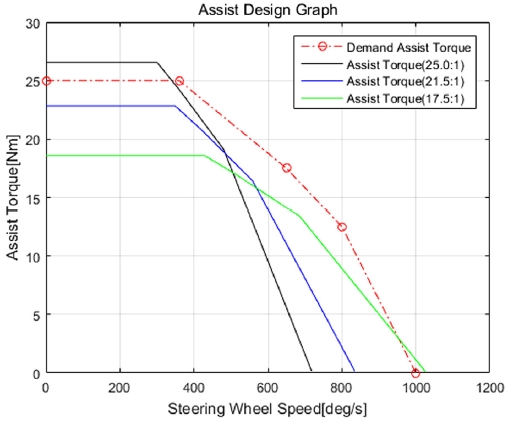
The prediction graph in Fig. 5 compares the assist outputs according to the reduction gear ratio at the rated torque output of the motor to satisfy the target output torque of the P-EPS. This result was obtained by using the T-N curve measurements in the motor unit test without applying the weak flux control.
As shown in Table 1, at the reduction gear ratio of 25:1, the target level of 25 Nm was reached when the driver entered the steering speed of 360 deg/sec into the EPS system. However, the other results were lower than the target value, indicating room for improvement in the future. Particularly in the result of the reduction gear ratio of 25:1, when the steering speed input to the EPS system was increased to 800 deg/sec, the motor output torque was almost 0 Nm. As a result of this simulation, the EPS assist output was also expected as 0 Nm.
To solve this problem, the motor performance and gear ratio change in the second year research project will be investigated.
3. P-EPS Control Design and Implementation
In this study, the control system for the hollow P-EPS for the MEV was designed and implemented as follows.
3.1 Configuration of the P-EPS Control Block Diagram
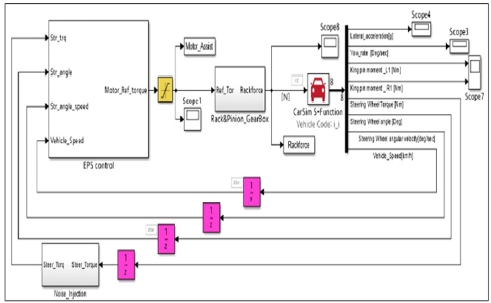
All the steering(upper) controllers were designed as an open loop system, and the control cycle could be controlled to 2 ms. In addition, the Carsim 9.0 software for dynamic vehicle simulation was used to predict and analyze the steering characteristics due to the EPS performance tuning.
Furthermore, an additional input was allowed, considering the external noise input to the steering input conditions of the steering(upper) control logic.
This motor(lower) controller was excluded in this study.
As shown in Fig. 6, the steering torque, steering angle, angular speed, and vehicle speed data output from Carsim were used as the input parameters for the steering(upper) control of the P-EPS developed by our company.
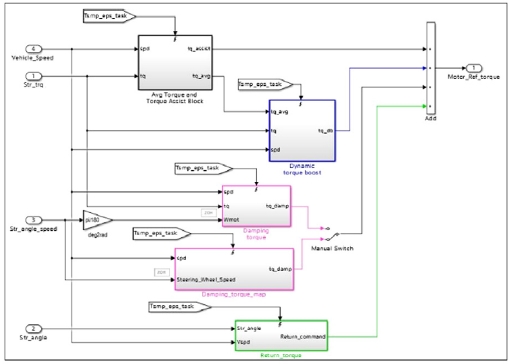
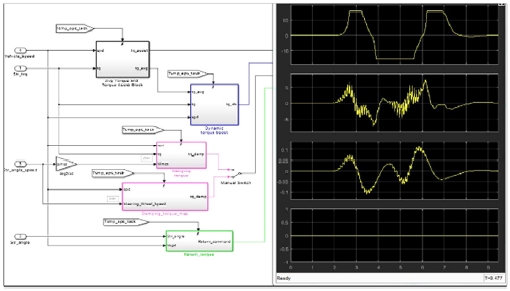
As shown in Fig. 7, the steering control blocks consist four major steering blocks: a controller module for controlling the motor current according to the vehicle speed, a controller module for compensating the motor current of sudden steering, a controller module for steering damping, and a controller module that restores the steering wheel to the origin in low-speed driving.
3.2 Verification of the P-EPS Unit Performance Based on the Model
The functional module of each controller was designed based on a mathematical model using MATLAB and Simulink, and the unit performance tests were performed by analyzing the output waveform of each controller. As shown in Fig. 8, the similarity of the output of each controller to the prediction was analyzed to verify the fitness to the target MEV.
The signal outputs from each steering controller module block are ultimately delivered as target following signals of the motor(lower) controller.
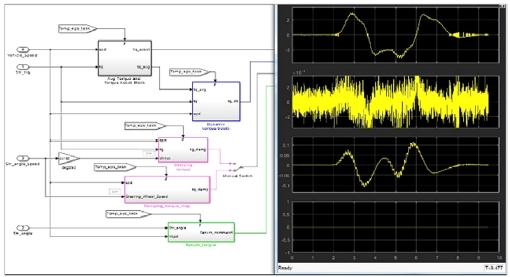
Furthermore, Fig. 9 shows the observation result of the output of each control block, obtained by applying an additional external noise input to the steering input value of the driver to verify the control performance in an actual steering environment. In this way, unit performance tests were conducted by applying external noise and various conditional assumptions to verify the performance and safety of each control block.
As mentioned above, the system was designed in module units to identify the degree of influence on each functional module or the degree of sensitive reaction of each module when performing unit performance tests with various conditional assumptions. This can improve the reuse rate of the control logic because it can be used to develop other vehicle types in the future.
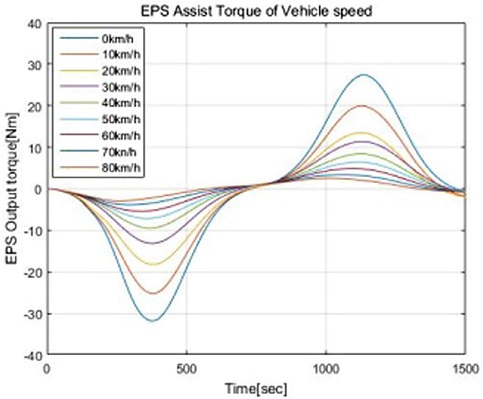
Furthermore, since the rack force changes according to the vehicle speed, the EPS maximum assist power was designed to be reduced through response control according to the vehicle speed, as shown in Fig. 10, for steering safety in high-speed driving conditions and for steering convenience in stationary conditions, by applying a different steering assist power to the driver.
Analysis of Fig. 10 shows that the EPS maximum assist power is changed by the left and right rotation directions of the steering depending on the vehicle speed. It is deemed that the control logic should be improved to compensate for such output difference. Thus, we plan to conduct a research on improvement through compensation using the additional information on the vehicle and the driver.
3.3 Vehicle Dynamics Analysis Using a Simulator
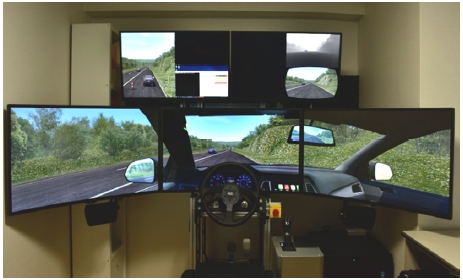
To perform tuning and verification of performance by applying the driver’s actual steering input to the P-EPS control system developed in this study, the existing simulator was improved as shown in Photo. 1.
In the test stage using the simulator in Photo. 1, a fixing jig was designed and applied to maintain a steering system mounting angle that was as close as possible to the angle of the target vehicle in this study. This is to set the limit of the tuning gain and to check the eccentricity and interference between the products according to the mounting angle when tuning the steering performance of the P-EPS in PG, which is the actual vehicle test stage, before mounting it to the vehicle. In addition, the operation environment software of the simulator was optimized(10 ms or less) so that the tuning environment of the P-EPS steering control logic would be as similar as possible to the actual environment. As an extension of this, we implemented step by step the fail-safety mode, which checks the predicted result of an intentionally injected failure by assuming a failure situation that can occur in high-speed driving and implements the corresponding compensation control logic. We are conducting further research on this topic.
To improve the performance of the P-EPS control logic developed in the previous study, we evaluated the steering performance using the Micro AutoBox and simulator, and analyzed the results as shown in Figs. 11 and 12.
There are five tests for the quantitative assessment of the steering performance: static effort, J-turn, on-center handling, flick, and return-ability. All these were performed through the simulator.
In this study, we analyzed the results of the On-Center Handling and Double Lane Change tests, which drivers most frequently perform while driving.
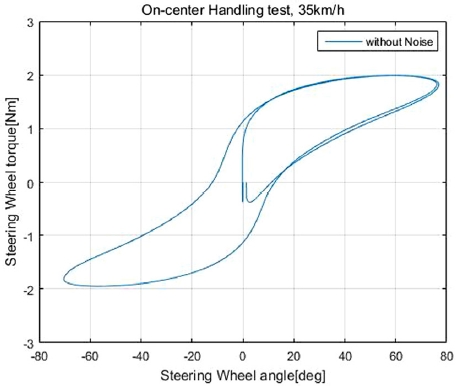
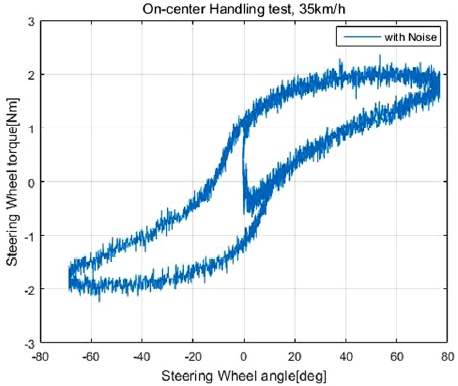
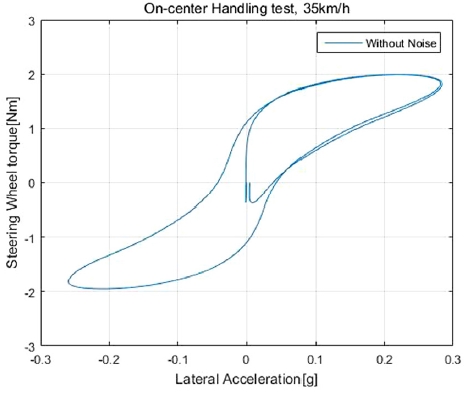
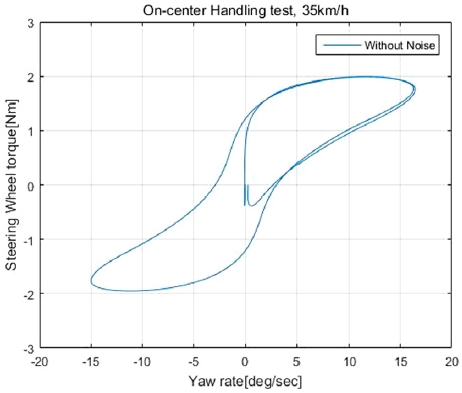
The on-center handling test is usually conducted in the main driving speed range of 60-100 km/h. However, considering that the maximum speed of the MEV developed in this study is 80 km/h, the test speed range was adjusted to 30-80 km/h. Figs. 11 and 12 show the results of the test at the vehicle speed of 35 km/h, which can demonstrate the full performance of the steering controller module block.
As shown in the graphs in Figs. 11 and 12, the width of the steering performance curve was generally symmetrical and uniform in the on-center region. However, in the off-center region, the steering torque gradient was gentle, and the change in the steering torque was small in the steering angle range of 50-60 deg.
Therefore, to improve the off-center region, we tuned the maximum current allowable limit gain of the assist torque map in the P-EPS control logic that our company developed. Furthermore, we are planning to tune the initial motor current use gain under the judgment that the driver feels that the initial torque is large in the on-center region.
This improvement direction was set because the shape and width of the steering are generally symmetrical, and the shape and width of the steering performance curve are similar to those in the previous result despite the additional noise input.
As shown in the result in Fig. 13, the steering torque hysteresis, compared to the lateral acceleration of the vehicle, has a uniform width. To analyze this more closely, 1.11 Nm was measured at 0 g, and 1.81 Nm at 0.1 g, which are different from the target steering stiffness value, and the torque gradient was also small, which indicates a problem with the steering sensitivity, which we are planning to improve. Fig. 14 shows the change in the steering torque hysteresis according to the change in the yaw direction of the vehicle.
The steering stiffness is also insensitive in this result and shows a significant difference from the target. Furthermore, the change in the yaw rate appeared wide in the range of 0-15 deg/sec for both the left and right sides. Thus, we are planning to conduct a study for gain tuning and the development and verification of an additional logic to reduce the yaw rate change.
In addition, the above hysteresis appeared in the range of 30-65 km/h, and the hysteresis of the simulation result from above 70 km/h showed a figure of eight. To analyze the cause of this, we are modifying the steering damping tuning parameter while changing the steering input torque speed (cycle) in 0.1 Hz units in the range of 0.3-0.5 Hz.
Furthermore, we are planning to perform additional complementary improvement of the design by analyzing, through design interpretation, the mechanical friction between the column and hollow motor.
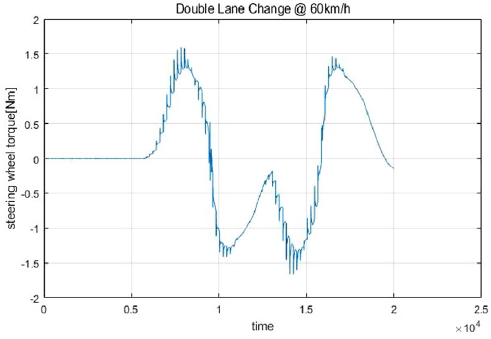
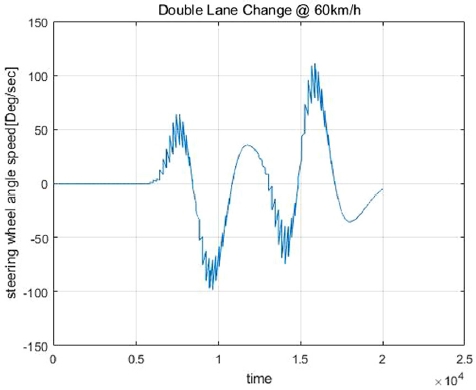
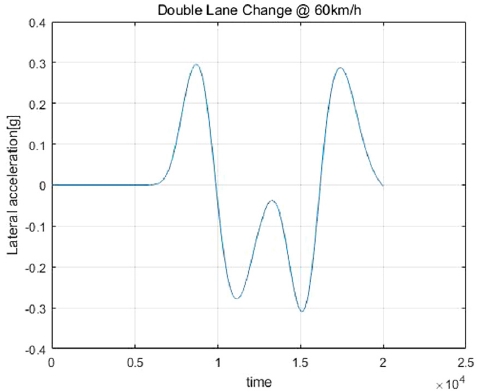
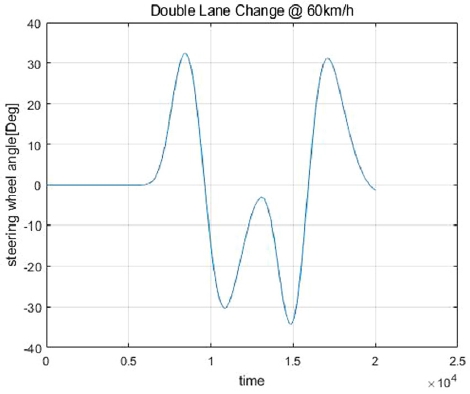
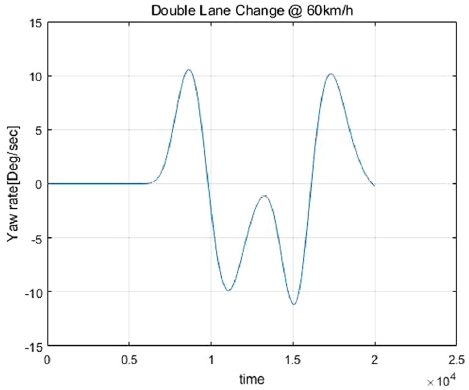
The results of the double lane change(DLC) are shown in the following graphs.
The graphs in Figs. 15, 16, and 17 show the results over time when the driver applied a physical input to the steering system. The graphs in Figs. 18 and 19 show the mobility of the vehicle using the steering system.
When the inputs were given to the P-EPS steering system under the speed of 60 km/h on a normal asphalt road in the Double Lane Change test of the target vehicle, as shown in Figs. 15, 16, and 17, the vehicle driving conditions were as shown in Figs. 18 and 19.
To analyze the vehicle driving conditions, the lateral accelerations of the vehicle were symmetrically stable when the vehicle changed from the first lane to the second lane, and when it returned from the second lane to the first lane.
Likewise, the yaw rate of the vehicle was symmetrical, which confirmed its stability. However, high-frequency vibrations were observed in the steering torque input. It was found that vibration occurred in the output values of the average filer in the assist control block in the applied control logic. Hence, we are comparing the yaw rate with the evaluation data of a vehicle class similar to that in this study among the data from past vehicle assessments. In addition, we are reviewing whether to apply an additional design of the low pass filter by checking the natural vibration frequency with the machine design team.
Finally, the target MEV in this study does not have an ABS braking system. Therefore, if the ABS braking system is applied to the project next year for comprehensive driving safety, the approach and complementary logic design can be different from the improvement direction of this study.
4. Conclusions
In this study, we proposed a planetary gear reduction ratio and an ECU block diagram concept for a P-EPS steering system that is suitable for a high-voltage MEV, and implemented the control logic using mathematical modeling.
In the results of the evaluation of the P-EPS steering system in a vehicle dynamics steering simulator, we analyzed whether the P-EPS steering system satisfied the target steering performance and derived improvement and supplementation points.
There are still technical problems that need to be addressed, as shown in the analysis results, but the tuning results are still within the expected range. We determined that the problems can be improved with our know-how in developing similar products.1-8)
- 1) The design of the MEV’s internal space was optimized using a hollow brushless motor and a three-speed planetary gear, unlike the existing P-EPS system, due to the small internal space of the target MEV.
- 2) The planetary gear ratio was designed to satisfy the target EPS output torque of 25 Nm of the quantitative assessment in this project by designing the P-EPS steering system using mathematical modeling. In addition, the motor torque and rotation speed were controlled in line with the gear ratio to prevent catch-up during sudden driver steering.
- 3) After the unit tests, the system response to and performance as regards the injection of faults, which is dangerous to perform in an actual vehicle, were verified using a simulator for system stability and performance tuning. We are designing and testing the fail-safety logic using these results and FMEA. In addition, for a more objective relative comparison of the vehicle dynamics, we configured and tested the simulator environment for the application of both Carsim and Carmaker.
- 4) The steering assessment results of the simulator test still have points to be supplemented and improved, but they can be solved by continuous tuning and a step-by-step approach because most of them are within the tunable range. We are also planning to conduct additional research on the control logic for compensation.
- 5) As the simulator test results show, the widths of the steering and vehicle reaction performance curves of the on-center handling are still uneven, and the off-center region generally showed large results. Thus, we plan to improve them through parameter tuning.
- 6) We are also planning to analyze the effects and cause of the high frequency in the DLC test and improve it through filtering. In addition, we will improve the steering safety by tuning the parameter with the goal of 3±0.5 Nm for the driver’s input steering torque.
- 7) Regarding the fault diagnosis mode, we plan to apply to the actual vehicle tuning the fault diagnosis cycle for basic sensors, motors, and ECU, the safety mode in the event of faults, and the recovery conditions. We are also establishing a step-by-step plan for reflecting functional safety design in the future.
Nomenclature
| Ktbar : | torsion bar compliance, deg/Nm |
| Btbar : | torsion bar damping, Nm/deg |
| Jmotor : | motor inertia, kgm2 |
| Mtor : | motor torque, Nm |
Subscripts
| H-ECU : | high-voltage electronic control unit |
| MEV : | micro-electric vehicle |
| ABS : | anti-brake system |
| PG : | proving ground |
| DLC : | double lane change |
| Lateral Acc : | lateral acceleration |
Acknowledgments
A part of this paper was presented at the KSAE 2020 Spring Conference
This study was performed as an automotive industry core technology development project(green car) of the government(20007447-Development of an electric steering system for the improvement of the driving stability of micro-electric vehicles).
References
-
Y. Park, B. Lee, S. Chang, H. Cho, M. Kim and S. Hwang “Model Based Optimal Design for MDPS Control Map to Meet Steering Feel Performance Targets,” Transactions of KSAE, Vol.27, No.10, pp.755-761, 2019.
[https://doi.org/10.7467/KSAE.2019.27.10.755]

- C. Kim, S. Kim, H. Kim and H. Choi, “Development of the Hardware Test Case of an 48V R-EPS Powerpack Module,” KSAE Fall Conference Proceedings, pp.394-395, 2018.
- C. Kim, D. Kim, Y. Ko, H. Choi and K. Noh “Vehicle Dynamics Model Development and Experimental Validation for the Application to the 48V R-EPS HILS Test,” KSAE Spring Conference Proceedings, pp.307-308, 2017.
- T. Lee, C. Kim and H. Choi, “Experimental Research on the Static Steering Performance Test of R-EPS for 48V System,” KSAE Spring Conference Proceedings, pp.309-312, 2017.
- B. Kim, S. Ahn and C. Lee, “The Design of the Friction Compensation Logic for Improving Inertia Feel of the Electric Power Steering System,” KSAE Spring Conference Proceedings, pp.605-607, 2015.
-
S. Kim and J. Kyeong, “Efforts of EPS Assist Torque on On-Center Steering Feel Indices,” Transactions of KSAE, Vol.22, No.3, pp.186-193, 2014.
[https://doi.org/10.7467/KSAE.2014.22.3.186]

- H. Lee, J. Seo, E. Kim, D. Park and J. Moon “EPS HILS Development for Fault Injection Test,” KSAE Annual Conference Proceedings, pp.821-826, 2012.
- D. Lee, C. Cho and C. Hong, “Research of the correlation between Subjective and Objective Evaluation of the Static Steering Effort,” KSAE08-S0139, pp.836-842, 2008.
- B. Jang, A Mathematical Model of a Power Steering System for Implementation in a Driving Simulator, M. S. Thesis, The Ohio State University, 1996.

