LPG/CNG Bi-fuel 차량의 실도로 모사 가상 주행사이클을 이용한 CO2 배출량 분석
Copyright Ⓒ 2019 KSAE / 163-09
This is an Open-Access article distributed under the terms of the Creative Commons Attribution Non-Commercial License(http://creativecommons.org/licenses/by-nc/3.0) which permits unrestricted non-commercial use, distribution, and reproduction in any medium provided the original work is properly cited.
Abstract
Many studies have been conducted of late on the performance optimization of vehicles using the synthetic driving cycle, by reflecting the driving characteristics of the real road. To evaluate the CO2 reduction performance in the actual road driving conditions of the LPG/CNG-bifuel vehicle developed for the domestic taxis, the driving characteristics of the domestic taxis were analyzed. Simulated real-world driving cycles reflecting normal, mild, and severe driving characteristics were developed using the Markov chain, which can predict the speed profile through a statistical method with minimal driving data. The CO2 emissions of the LPG/CNG-bifuel vehicle were measured during the vehicle chassis dynamometer testing over the developed synthetic cycles and certification standard cycles, and the correlation between the driving characteristics and the CO2 emissions was analyzed. The CO2 emissions were found to be highly correlated with the RPA of the driving cycles, and the CNG fuel mode showed a 13.7 % CO2 emission reduction compared to the LPG fuel mode under real driving conditions.
Keywords:
Simulated real-world driving cycle, Markov chain, Relative positive acceleration, Bi-fuel vehicle, CO2 emission키워드:
실도로 모사 가상주행 사이클, 마르코프 체인, 상대가속도, 바이퓨얼 차량, 이산화탄소 배출가스1. 서 론
차량의 연비 및 배출가스 배출량을 표준화된 조건에서 평가하기 위해 차대동력계에서 표준 속도 프로파일을 활용해 평가하고 있으며, 평가에 활용되는 모드에 대해 실도로의 특성을 반영하기 위해 Andre는 유럽의 승용차량의 주행특성을 반영하여 ARTEMIS 주행 사이클을 개발하여 활용하고 있으며,1) UNECE의 WLTP/DHC에서는 유럽, 미국 및 아시아 국가의 차량 주행 DB를 기반으로 국제 표준화 사이클을 개발하여 EURO-6c 규제에 적용하였다.2) 최근에는 전력 기반자동차의 개발 등과 맞물려 특정 차종과 지역의 도로 주행 특성을 반영한 주행 사이클의 개발과 평가에 대한 연구가 Lee와 Fellah 등을 통해 진행되었다.3-5) 주행 사이클 생성은 실제 도로에서 취득한 주행 DB를 조합하여 생성하는 방법과 취득한 주행 데이터를 분석하여 확률 통계적 방법을 통해 현재 시점에서 다음 시점의 속도를 예측하여 생성하는 Modal cycle construction 방법으로 크게 구분된다. 이러한 사이클 생성 방법들을 이용하여 특정 운행패턴의 차량의 특성을 반영한 주행 사이클을 개발하고, CO2 배출 및 배출가스에 대한 비교 평가를 통한 개발이 부각되고 있다.6)
본 연구에서는 국내 택시에 활용되는 LPG 차량을 대상으로 개발된 CNG bi-fuel 시스템의 CO2 저감 성능을 평가하기 위해 택시의 실도로 주행 특성을 반영한 주행 사이클을 개발하고 차대동력계 시험을 통해 이를 평가하였다.
2. 실도로 모사 가상 주행 사이클 생성
2.1 대상 차량 주행 특성 분석
대상 차량인 택시의 주행 특성을 파악하기 위해 서울 및 경기도 지역에서 운행 중인 10대의 차량에 주행기록계를 부착하여 하루 8시간 이상의 주행이 수행된 2일간의 218시간, 3,956 km의 주행 데이터를 대상으로 분석을 수행하였다.
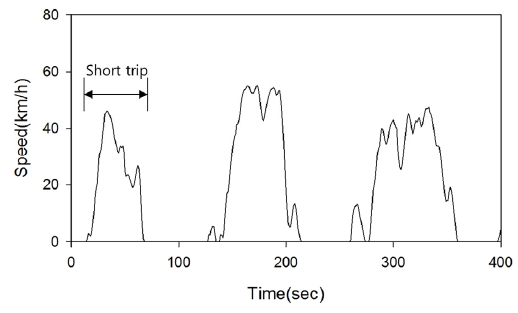
주행 특성의 분석을 위해 각 주행 구간에서 Fig. 1에서와 같이 속도가 0 km/h 이상으로 상승하여 차량이 주행한 뒤 다시 정지하는 한 개의 구간을 단위 주행 구간인 Short-trip으로 설정하고, Short-trip의 평균 속도와 RPA(Relative Positive Acceleration)를 주요 변수로 선정하여 분포를 비교하였다. RPA는 식 (1)과 같이 정의되고, 특정주행 구간에 대해 차량의 부하 특성을 나타내는 변수로 폭 넓게 활용되고 있다.7,8)
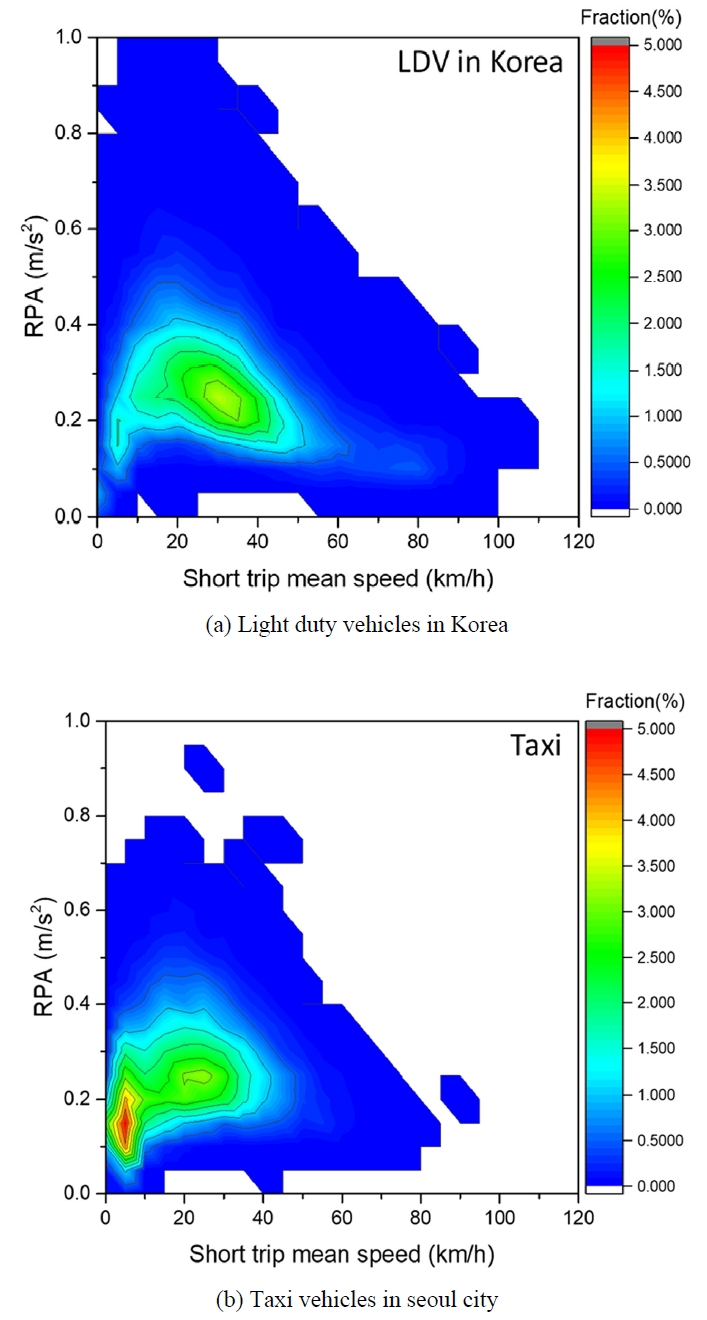
택시의 주행 특성과 국립횐경과학원에서 취득된 국내 소형차의 주행 특성9)과 비교하면 도심 운행의 비율이 높은 택시는 각 단위 주행구간의 평균속도가 상대적으로 낮은 속도를 나타내며, 평균속도 10 km/h 이하의 비율이 높은 특성을 나타냄을 Fig. 2에서 확인할 수 있다. 또한 배출가스 및 연비 평가를 위해 활용되는 표준 주행 사이클의 각 단위 주행구간의 평균 속도 및 RPA 분포를 비교해 보면 Fig. 3과 같이 표준 주행 사이클은 국내 소형차량의 주행 특성과 높은 상관성을 나타내나, Fig. 4와 같이 평균속도 60 km/h 이상의 분포가 적은 택시의 주행 특성을 반영하지 못함을 확인 할 수 있다. 본 연구에서는 개발 대상 차종의 특성을 반영하여 표준화된 조건에서 평가하기 위해 택시의 실도로 주행 특성을 반영한 주행 사이클 개발을 수행하였다.
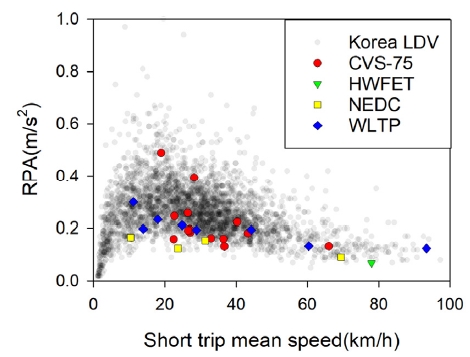
Characteristics of averaged vehicle speed and RPA of short trips in real road of LDV and certification test modes
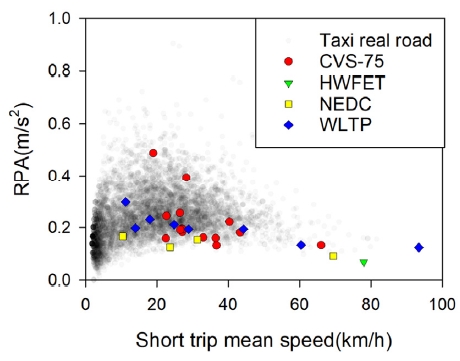
Characteristics of averaged vehicle speed and RPA of short trips in real road of taxi and certification test modes
| (1) |
2.2 실도로 모사 가상주행 사이클 생성 방법
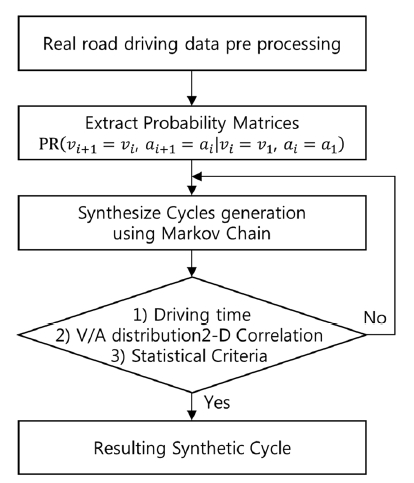
택시의 주행 특성을 반영한 주행 사이클의 개발은 적은 양의 주행 데이터를 활용하여 주행 특성을 모사한 주행 사이클 생성에 장점을 갖는 Modal cycle construction 방법을 적용하였다. 본 연구에서는 Markov chain을 적용하여 Fig. 5와 6에 나타낸 것과 같이 취득된 차량의 주행데이터를 분석하여 속도 및 가속도 분포를 도출하고, 각 속도/가속도에서 다음 시점에서 속도의 확률적 분포를 나타내는 TPM(Transition Probability Matrix)을 도출하였고, 매 순간에서 다음 순간의 속도를 TPM을 통해 예측하여 사이클을 생성하는 확률/통계적 방법을 적용하였다.3)
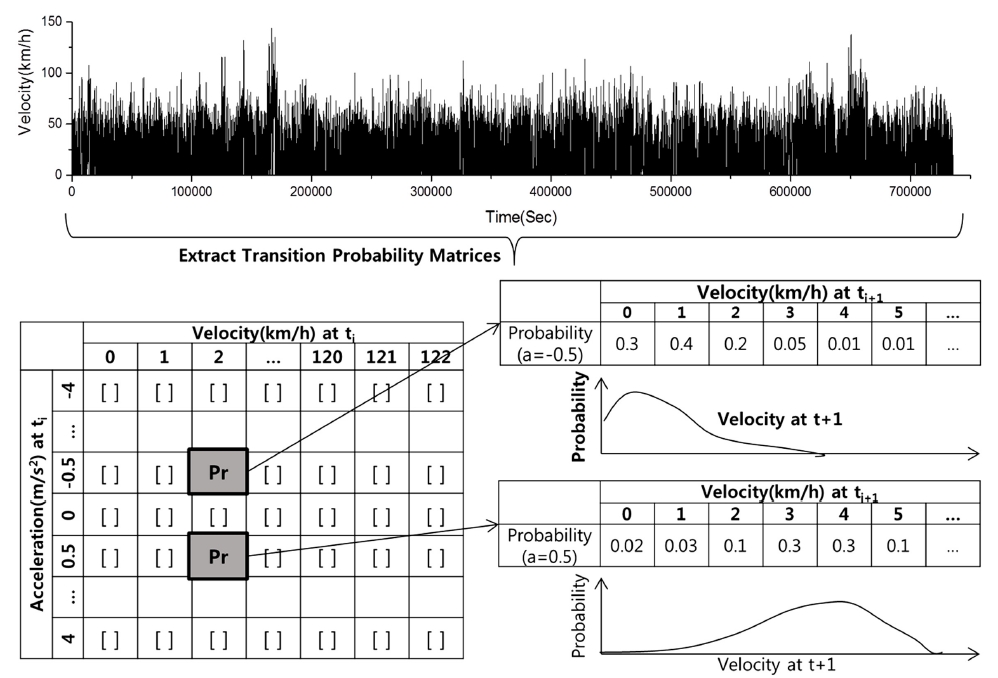
Illustration of the procedure to extract transition probability matrix and the structure of the transition probability matrix(TPM) at a given velocity and acceleration
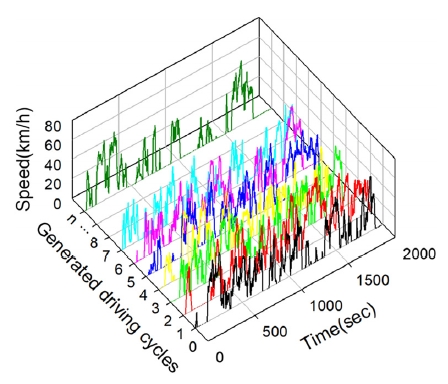
주행 사이클의 생성을 위한 주행 데이터는 전술한 서울지역의 택시 주행 데이터를 전처리하여 활용하였으며, 속도 1 km/h, 가속도 0.3 m/s2의 구간으로 나누어 속도/가속도 분포 및 TPM을 도출하였다. 가상 주행 사이클은 Markov chain을 적용하여 1,000개의 사이클을 생성하였으며, 생성된 사이클에 대해 주행시간, 평균속도, 평균 주행속도, 공회전 비율, 정차 횟수 등의 주행 통계 분석을 통해 가상 주행 사이클을 1차로 선택하였으며, 생성된 사이클의 예를 Fig. 7에 나타내었다. 1차로 선택된 사이클에 대해 실도로의 속도/가속도 분포와 생성된 사이클의 속도/가속도 분포의 2D-상호 상관 분석을 통해 상관성이 높은 사이클을 선택하였다.
2.3 실도로 모사 가상주행 사이클 생성 결과
대상 차량의 실도로 주행 특성을 모사하여 RPA가 0.24 m/s2인 2종의 일반 주행 사이클(RDE#1, #2)을 생성하였으며, 차량의 주행의 가혹도에 대한 영향을 분석하기 위해 사이클 생성 시 가속도에 가중치를 부여하여 PRA 0.22 m/s2의 완화 주행 사이클(RDE#3)과 0.27 m/s2의 가혹 주행 사이클(RDE#4)을 개발하여 분석에 활용하였다. 개발된 4종의 주행 사이클의 트립별 평균 속도와 RPA를 실도로 주행 특성과 비교해 보면 Fig. 8과 같이 일반, 완화 및 가혹 주행 사이클은 실도로 주행 특성을 반영함을 확인할 수 있으며, 가혹 주행 사이클은 평균 속도 10~30 km/h 구간에서 RPA가 높은 특성을 반영하고 있고, 완화 주행 사이클은 평균 속도 20~40 km/h 구간에서 RPA가 낮은 특성을 반영하고 있다.
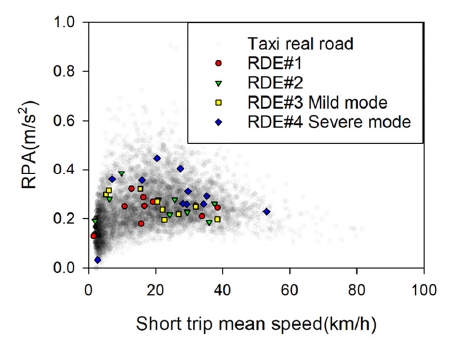
Characteristics of averaged vehicle speed and RPA of short trips in real road of taxi and simulated real-world driving cycles
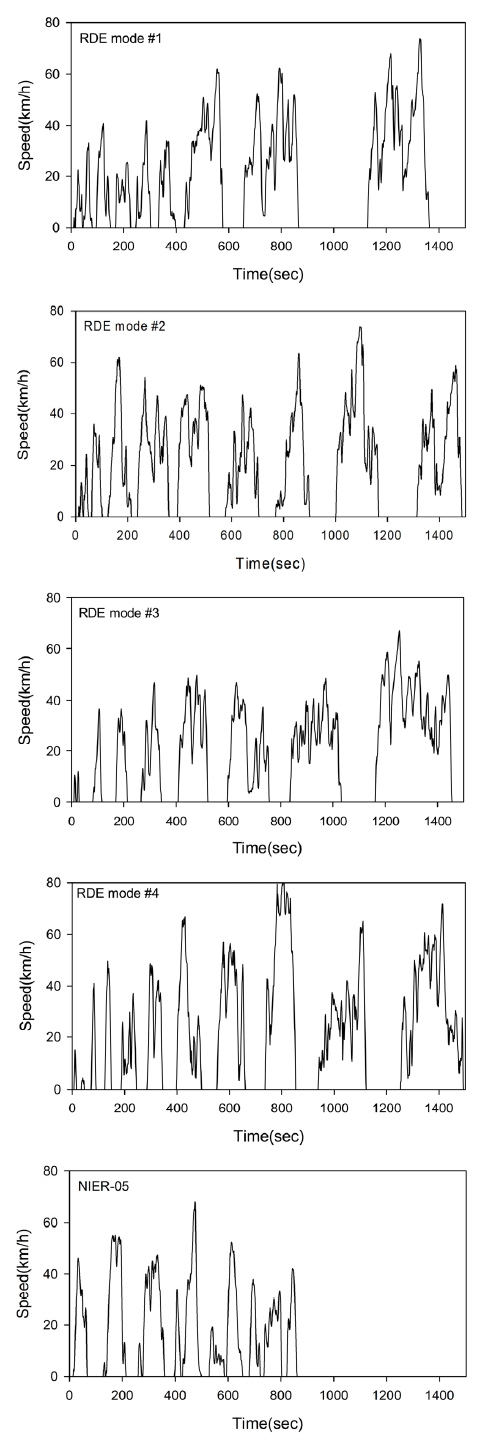
개발된 4종의 주행 사이클과 택시와 유사한 주행 특성을 갖고 있는 것으로 알려져 있는 국립환경과학원 NIER-05 주행 사이클을 시험에 추가로 적용하였으며,6) 개발된 4종의 실도로 모사 사이클 및 NIER-05 모드의 속도 프로파일을 Fig. 9에 나타내었다. 대상차량의 실도로, 인증용 표준 주행 사이클, NIER-05 및 개발된 4종의 주행 사이클의 주행 특성을 Table 1에 비교하였다. 개발된 주행 사이클은 실도로와 평균 차속, 평균 주행 속도 및 정차비율 등이 유사함을 확인 할 수 있으며, 인증용 표준 주행 사이클은 주행 특성이 실도로와 상이함을 확인할 수 있다.
3. 온실가스 배출량 시험 결과
3.1 시험 방법 및 차량
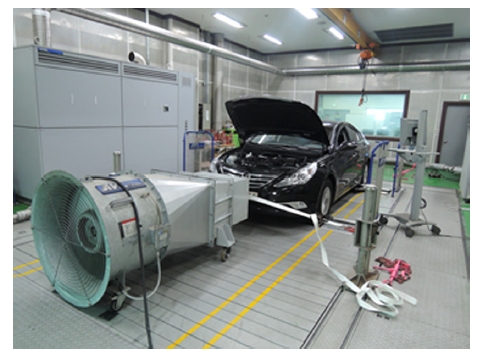
시험 대상 차량은 택시로 활용되는 2L급 LPG 액상분사 MPI 엔진 적용 차량을 CNG bi-fuel로 개조한 차량으로 LPG 연료 사용 시 복합 CO2 배출량은 140 g/km이며 차량제원을 Table 2에 나타내었다. CNG bi-fuel 시스템은 고압의 CNG를 감압하여 각 흡기 매니폴드에 분사하는 MPI 방식으로 구성되었으며, CNG의 연료 분사량의 제어는 LPG ECU의 인젝터 분사기간을 계측하고 보정계수를 적용하여 다음 사이클에 CNG를 분사하는 인터페이스 ECU방식이 적용되었다. 이에 따라, 배출가스 및 연비에 중요한 영향을 미치는 공연비 제어를 포함한 엔진 제어는 메인 LPG ECU에서 관장하게 된다. CO2 배출량 시험은 차대동력계에서 동일한 주행저항이 인가된 상황에서 수행되어진다. CO2 배출량의 측정은 차대동력계에서 배기관에서 배출된 배기가스가 희석터널에서 희석된 후 백에 포집된 뒤 배출가스 분석기에서 측정된다. Fig. 10에 차대동력계 시험 모습을 나타내었다.
3.2 시험 결과
차대동력계에서 인증 시험용 주행 사이클인 CVS-75, HWFET 모드와 택시와 비교적 주행 특성이 유사한 NIER-05 모드 및 본 연구를 통해 개발된 가상 주행 모사 사이클인 RDE #1~4에 대해 시험을 수행하였다. 각 주행 모드에 대해 시험은 2회씩 수행하여 유사성을 확인 후 평균하여 제시하였다.
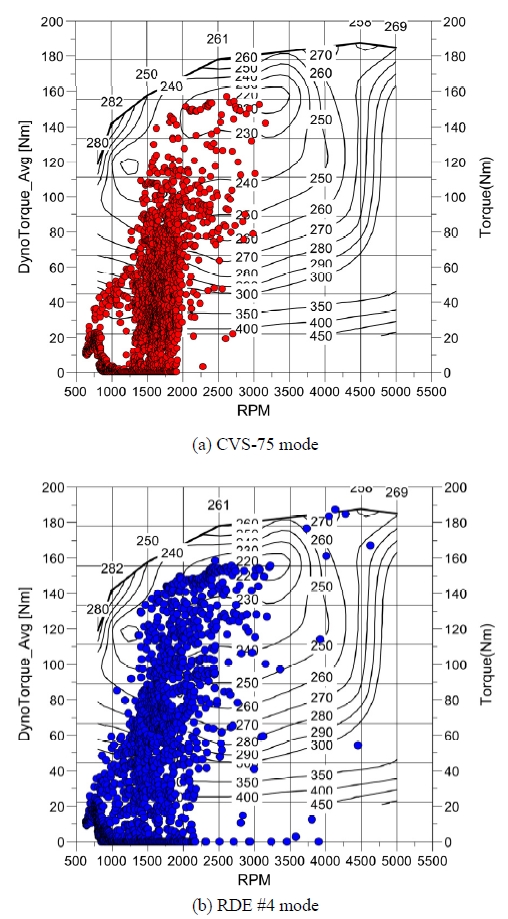
주행 사이클의 차이에 따른 엔진 작동영역의 비교를 위해 CVS-75 모드와 가혹 주행을 모사한 RDE #4의 엔진 작동영역을 Fig. 11에 나타내었다. 엔진 회전수 1300~2000 rpm, 토크 120 Nm 이하 구간에서 대부분의 작동 분포를 갖는 CVS-75 모드와 달리, RDE #4 모드는 평균 차속이 낮음에도 엔진 회전수가 최대 4000 rpm까지 높고, 토크 160 Nm까지 넓은 운전 영역을 나타냄을 알 수 있다.
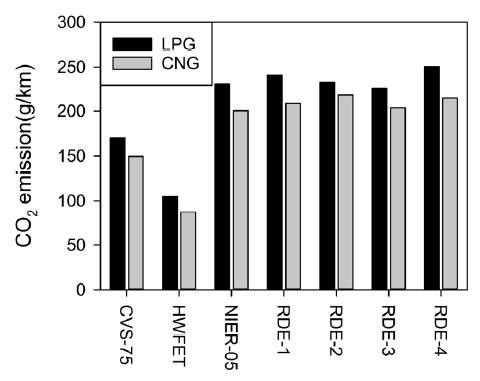
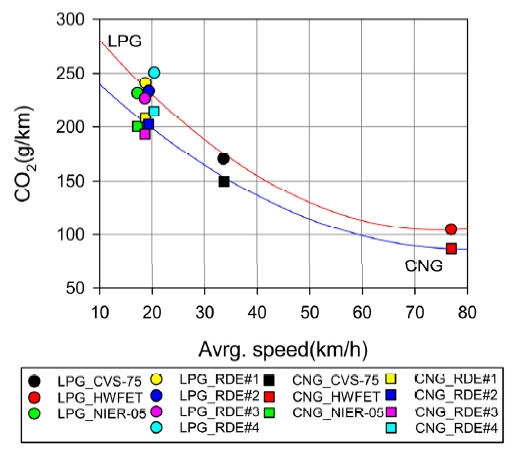
각 모드에 대해 LPG와 CNG의 CO2 배출량을 Fig. 12에 나타내었다. CNG는 메탄(CH4)을 주성분으로 하여 연료 내 탄소의 질량비가 74.9 %로 부탄(C4H10)이 주성분인 LPG의 탄소 질량비 82.6 %보다 낮은 저탄소 연료이기 때문에 LPG와 비교하여 낮은 CO2 배출량을 나타냄을 확인할 수 있다.
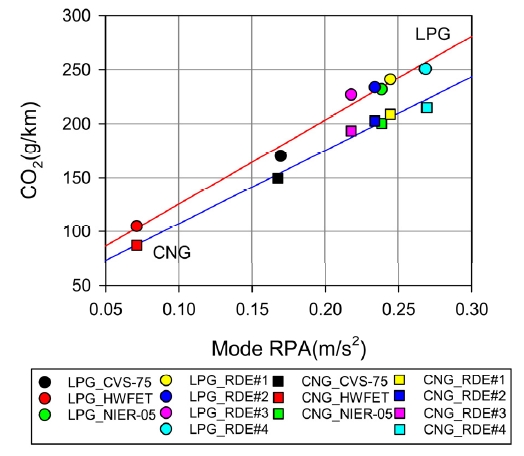
CO2 배출량은 일반적으로 일정 주행 속도까지는 평균주행 속도가 상승함에 따라 감소하는 경향을 나타내는 것으로 알려져 있으며,10) Fig. 13에 나타낸 것과 같이 LPG와 CNG 유종별 시험 결과에서도 차속이 증가함에 따라 CO2 배출량이 감소하는 경향이 나타남을 확인할 수 있다. 하지만 유사하게 20 km/h의 평균 차속을 갖는 NIER-05 모드와 RDE#1~4 모드 간 CO2 배출량의 분산이 크게 나타난다. 이는 평균 속도는 유사하나 모드의 가혹도의 차이에 기인한 것으로 이를 파악하기 위해 Fig. 14에는 주행 사이클의 RPA와 CO2 배출량의 관계를 나타내었다. CO2 배출량은 RPA와 선형적으로 비례하며 1차 함수로 회기 분석하였을 때 상관계수(r2)가 LPG 연료 0.986, CNG 연료 0.989로 높은 상관성을 나타낸다. 이를 통해 유사한 평균 차속의 주행 모드에서 RPA가 높아 상대적으로 높은 가감속 특성을 갖는 주행모드에서 CO2 배출량이 높게 배출됨을 확인할 수 있다.
시험 차량에서 LPG와 CNG 연료에 대해 RPA에 대한 CO2 배출량의 1차 회귀 분석 결과를 이용하여 CNG 연료 적용시 LPG 연료와의 CO2 배출량의 비교가 가능하다.
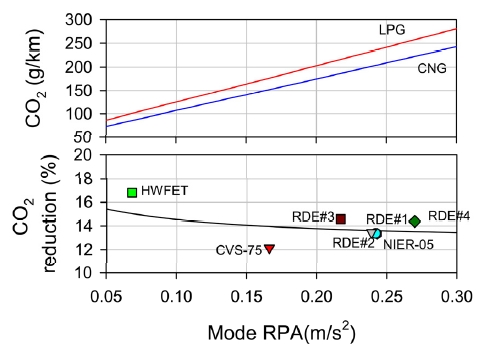
Fig. 15에 CNG와 LPG 연료 적용 시 CO2 배출량과 CO2 저감율을 실선으로 나타내었으며, 차대동력계에서 측정된 CO2 저감율을 비교하여 표시하였다. CO2 저감율은 RPA가 낮은 CVS-75와 HWFET 모드의 경우 CO2 배출량이 적어 저감율의 1.8 %의 편차를 나타내나, 그 외의 모드에서는 1 % 이하의 편차를 나타낸다.
회기 분석 결과를 사용하여 유종간 CO2 배출량을 비교하면, 차대동력계에서 주행 모드 시험에서 발생되는 시험 오차에 대한 영향의 최소화가 가능하며, 시험을 수행하지 않은 다른 주행 모드 및 차량 운행조건에서의 CO2 배출량의 비교가 가능하다. 실도로 주행 조건인 RPA 0.226 m/s2 조건에서는 13.7 %의 CO2 저감이 가능할 것으로 추정이 가능하다.
4. 결 론
- 1) CNG bi-fuel 차량의 대상 차량인 택시의 실도로 주행특성을 분석하여 표준 시험 모드와 비교를 통해 주행모드 개발 필요성을 확인하였으며, 실도로를 모사하여 일반, 완화 및 가혹 주행모드 4종을 개발하였다.
- 2) 차대동력계에서 인증용 표준 시험 모드와 실도로 모사 모드에 대해 LPG와 CNG 연료에 대해 CO2 배출량을 평가하였으며, 인증 모드와 실도로 모사모드의 엔진의 작동영역의 변화를 확인하여 실도로 모사 모드의 필요성을 확인하였다.
- 3) 주행 변수 중 RPA가 CO2 배출량과 높은 선형적인 상관관계를 나타냄을 확인하였고, 회기 분석 결과를 이용해 실도로 조건에서 CNG 연료의 CO2 저감율을 추정하였다.
- 4) 실도로 모사 모드의 개발과 활용을 통해 실도로 주행조건에서의 CO2 저감율을 평가하는 프로세스를 도출하였다. 이를 통해 CNG/LPG bi-fuel 차량에서 CNG 연료로 운전할 경우 CO2 배출량을 13.7 % 저감할 수 있음을 확인하였다.
Nomenclature
| RPA : | relative positive acceleration, m/s2 |
| υ : | vehicle speed, km/h |
| a : | acceleration, m/s2 |
| dist : | distance travelled in a trip, km |
| n : | time duration in a trip |
Acknowledgments
이 연구는 2018년도 산업통상자원부 및 산업기술평가관리원(KEIT) 연구비 지원에 의한 연구임(20002762).
References
- M. Andre, “The ARTEMIS European Driving Cycles for Measuring Car Pollutant Emissions”, Science of The Total Environment, 334-335, p73-84, (2004).
- UNECE, Worldwide Harmonized Light Vehicles Test Procedure(WLTP), UNECE, (2012).
- T. Lee, and Z. Filipi, “Synthesis and Validation of Representative Real-World Driving Cycles for Plug-In Hybrid Vehicles”, IEEE Vehicle Power and Propulsion Conference, p1-6, (2010).
-
T. Lee, B. Adornato, and Z. Filipi, “Synthesis of Real-World Driving Cycles and Their Use for Estimating PHEV Energy Consumption and Charging Opportunities: Case Study for Midwest/ U.S.”, IEEE Transactions on Vehicular Technology, 60(9), p4153-4163, (2011).
[https://doi.org/10.1109/tvt.2011.2168251]

- M. Fellah, G. Singh, A. Rousseau, and S. Pagerit, “Impact of Real-World Drive Cycles on PHEV Battery Requirements”, SAE World Congress Experience, (2009).
-
C. Lin, H. Peng, and J. Grizzle, “A Stochastic Control Strategy for Hybrid Electric Vehicles”, Proceedings of the 2004 American Control Conference, 5, p4710-4715, (2004).
[https://doi.org/10.23919/acc.2004.1384056]

-
J. Demuynck, D. Bosteels, M. Paepe, C. Favre, J. May, and S. Verhelst, “Recommendations for the New WLTP Cycle Based on an Analysis of Vehicle Emission Measurements on NEDC and CADC”, Energy Policy, 49, p234-242, (2012).
[https://doi.org/10.1016/j.enpol.2012.05.081]

-
S. Kwon, Kwon, S., H. Kim, Y. Seo, S. Park, and M. Chon, “A Study on the Characteristics of Simulated Real Driving Emissions by Using Random Driving Cycle”, Transactions of KSAE, 24(4), p454-462, (2016).
[https://doi.org/10.7467/ksae.2016.24.4.454]

-
K. Choi, J. Park, J. Lee, J. Kim, K. Lee, and Y. Yi, “Research on Domestic Driving Pattern for International Standardization of Light-duty Vehicles Emission Test Method”, Journal of Korean Society of Transportation, 30(1), p31-43, (2012).
[https://doi.org/10.7470/jkst.2012.30.1.031]

- T. Lee, Keel, J., J. Park, Y. Park, J. Hong, and D. Lee, “Speed-Based Emission Factor regarding Vehicle Specific Power and Acceleration during On-road Driving”, Transactions of KSAE, 19(1), p73-81, (2011).

