바이오디젤 축소 화학반응 메커니즘의 반응속도 변경에 따른 Soot 배출량 오차 개선
Copyright Ⓒ 2023 KSAE / 214-03
This is an Open-Access article distributed under the terms of the Creative Commons Attribution Non-Commercial License(http://creativecommons.org/licenses/by-nc/3.0) which permits unrestricted non-commercial use, distribution, and reproduction in any medium provided the original work is properly cited.
Abstract
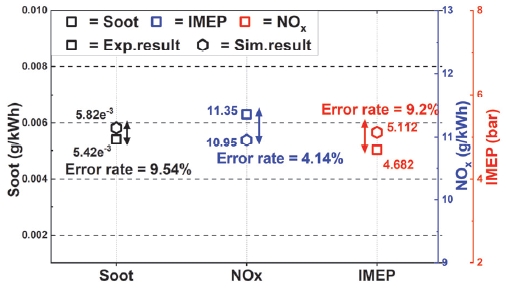
In this study, a chemical reaction mechanism reduction was performed to address lengthy simulation times resulting from the complex chemical structure of the chemical reaction mechanism that is used in simulating the oxidation process of fuel in combustion simulations. Mechanism reduction was achieved by removing the chemical species and reaction equations that were considered low in importance in the chemical reaction mechanism. Likewise, mechanism synthesis and coupling were performed for soot calculation. However, errors occurred in the simulation results due to the removal of the chemical species and reaction equations. Therefore, the pre-exponential factor of the Arrhenius equation was adjusted to improve accuracy. Thus, a reduced chemical reaction mechanism for biodiesel was developed, resulting in a 9.54 % error for soot, 4.14 % error for NOX, and 9.2 % deviation for IMEP.
Keywords:
Arrhenius equation, Kinetic chemical mechanism, Particulate matter, Pre-exponential factor, Soot model키워드:
아레니우스 식, 화학 반응 메커니즘, 입자상 물질, 선지수함수 인자, Soot 모델1. 서 론
강화되는 내연 기관의 배기가스 규제로 인해 디젤 엔진은 DPF(Diesel Particulate Filter), SCR(Selective Catalyst Reduction) 및 DOC(Diesel Oxidation Catalyst)등과 같은 후처리 장치1)들의 연구와 연소 과정에서 발생하는 배기 배출물 저감을 위한 연구가 활발하게 수행되고 있다.
연소 과정에서의 배기 배출물 저감 연구는 연소 과정에서 실린더 내부의 관찰이 어려운 실제 실험보다는 화학종들의 생성과 소멸 과정을 분석할 수 있는 3D CFD(Computational Fluid Dynamics) 엔진 시뮬레이션을 통한 연구가 주로 수행되고 있다.2-4)
CFD 해석에서 사용되는 화학반응 메커니즘은 연료가 산화되는 과정에서 발생하는 모든 화학종(Species)과 반응식(Reaction) 및 열역학적 상태량에 대한 정보가 포함되어 연료의 산화 과정 모사에 사용된다. 그러나, 바이오디젤의 화학반응 메커니즘은 탄소와 산소가 결합된 복잡한 형태의 FAME(Fatty Acid Methyl Ester) 구조로 인해 4,800개의 화학종과 20,000개의 반응식이 화학반응 메커니즘에 포함된다.5) 이로 인해, 바이오디젤은 다양한 물리 현상을 고려하는 3D CFD 엔진 시뮬레이션의 해석 시간이 과도하게 요구되며, 해석의 수렴성과 신뢰성이 감소하는 문제가 발생한다.6)
이러한 문제점을 해결하기 위해 일반적으로 탄화수소계 연료의 화학반응 메커니즘은 연료의 조성을 대신 모사하는 연료 대체물(Fuel surrogate)을 사용하여 화학반응 메커니즘에 포함된 화학종과 반응식의 개수를 감소시키지만, 연료 대체물 사용에도 불구하고 바이오디젤 연료 대체물 화학반응 메커니즘은 3,299개의 화학종과 10,806개의 반응식이 포함되어7) 여전히 긴 해석시간이 요구된다.
따라서, 일반적으로 연구자들은 화학반응 메커니즘에서 중요도가 낮은 화학종과 반응식을 제거하는 메커니즘 축소를 통해 화학반응 메커니즘의 해석시간을 단축한다. 메커니즘 축소는 화학종 간의 연관성을 분석하여 낮은 연관성의 화학종을 제거하는 DRG(Directed Relation Graph),8) 연소 과정에서 사용자가 설정한 경계값 이하의 몰분율을 갖는 화학종을 제거하는 PCA(Peak Concentration Analysis),9) 사용자가 지정한 오차율에 도달할 때까지 중요도가 낮은 화학종을 순서대로 제거하는 FSSA(Full Species Sensitivity Analysis)10) 등과 같은 다양한 축소 기법이 사용되고 있다. 하지만, 메커니즘 축소는 화학반응 메커니즘에 포함된 화학종과 반응식을 제거하기 때문에 오차가 동반되며,11) 연구자가 목표한 결과와 사용한 메커니즘 축소 기법 및 조건에 따라 메커니즘에 포함된 화학종과 반응식의 개수와 오차율이 달라진다.
이러한 이유로 Herbinet 등7)이 개발한 바이오디젤 상세 메커니즘을 기반으로 메커니즘 축소를 수행한 여러 선행연구들은9,12,13) 연구자의 목표에 따라 서로 다른 결과를 도출한다. 먼저, Brakora 등9)이 개발한 축소 메커니즘은 3D 해석을 통해 실제 실험 결과와 비교를 수행하였지만, 저온 영역에서 최대 50 %의 점화지연 오차를 보이며 Soot에 대한 검증이 미흡하였다. Zhang 등11)의 축소 메커니즘은 0D 해석을 통해 Soot을 검증하였지만, 30 % 정도의 점화지연(Ignition delay) 오차가 발생하였고, NOX에 대한 검증이 수행되지 않았다. 또한, Luo 등13)의 축소 메커니즘은 점화지연과 관련된 연료 및 라디칼(Radical) 화학종에 대한 개선을 통해 1,100 K 이상의 고온 영역에서 높은 점화지연 정확도를 보였지만, 1,100 K 이하의 저온 영역과 NOX, Soot과 같은 배기 배출물에 대한 검증이 수행되지 않았다.
이러한, 선행 연구들은 3D 해석이 아닌 0D 해석을 기반으로 수행되었으며, NOX와 Soot과 같은 배기 배출물과 점화지연을 동시에 검증한 연구는 수행되지 않았다. 또한, 모든 선행 연구에서 1,100 K 이하의 저온 영역의 오차가 크게 발생하는 결과를 보였다. 이는 바이오디젤 화학반응 메커니즘의 저온 영역은 연료의 산화를 모사하기 위한 화학종과 반응식이 고온 영역보다 밀집되었고, 메커니즘 축소로 인한 오차가 저온 영역에서 크게 발생하여 고온 영역에 비해 오차 개선이 어렵기 때문이다.
따라서, 본 연구에서는 선행 연구자들이 고려하지 않은 Soot 배출량과 저온 영역에서의 오차를 고려한 신뢰성 높은 바이오디젤 축소 화학반응 메커니즘 개발을 위해 3D CFD 해석 결과와 실험 데이터와의 비교를 통해 Soot 배출량, 점화지연, 실린더 압력, IMEP 및 열 방출률의 오차를 개선하였다.
2. 연구 방법
2.1 바이오디젤 축소 화학반응 메커니즘
본 연구에서 사용된 축소 화학반응 메커니즘은 247개의 화학종과 1,129개의 반응식이 포함된 Jung 등14)이 개발한 바이오디젤 축소 화학반응 메커니즘을 사용하였다. 해당 메커니즘은 개발 과정에서 Wang 등15)의 N-heptane 메커니즘을 합성하여 Soot의 전구체 물질인 PAHs(Polycyclic Aromatic Hydrocarbon) 화학종에 대한 정보가 포함되어 있다.
2.2 CFD 해석 방법
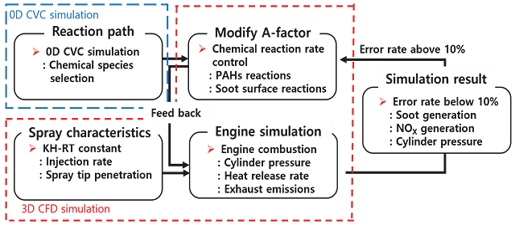
본 연구는 3D CFD 해석으로 바이오디젤의 Soot 생성량 예측을 위해 0D CVC 해석과 3D CFD 해석을 수행하였으며, 바이오디젤의 메커니즘 개발을 위한 시뮬레이션 과정은 Fig. 1과 같이 진행되었다.
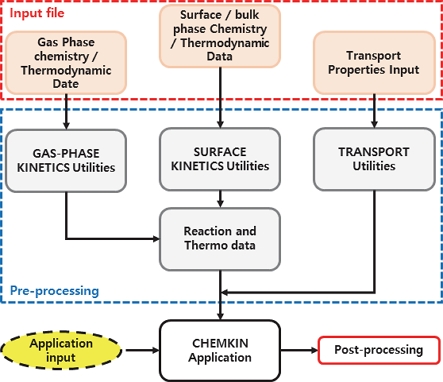
본 연구에서는 엔진에서 산화가 시작되는 조건에서 발생하는 화학종의 반응 경로를 분석하기 위해 연소 전문 해석 프로그램의 0D CVC(Constant Volume Combustion) 해석 모델을 사용하였다. 이 프로그램은 Fig. 2와 같이 연료 산화 모사를 위해 사용되는 다양한 Input 파일을 커플링하는 전처리 과정이 필요하다.
본 연구에서 사용된 Input 파일은 Jung 등14)이 개발한 바이오디젤 축소 메커니즘의 Gas phase kinetic chemistry와 Thermodynamic data를 사용하고, Soot 계산에 사용되는 Surface chemistry는 Chou 등16)이 개발한 Soot surface 메커니즘을 사용하였다.
3. 엔진 실험
개발된 바이오디젤 축소 화학반응 메커니즘의 검증은 커먼레일 단기통 CI 엔진으로 바이오디젤의 분무 가시화 및 연소 실험을 진행한 Park 등17)의 실험 데이터를 사용하였고 실험에 사용된 엔진 사양과 실험 조건은 Table 2와 같이 정리하였다.
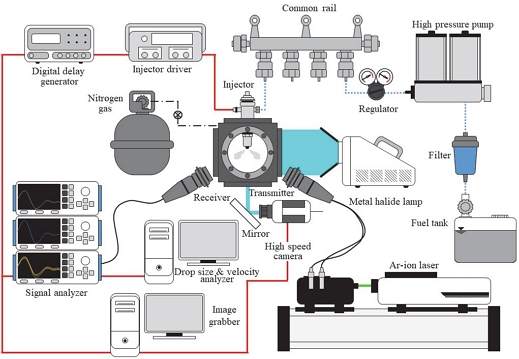
Fig. 3은 분무 가시화 실험 장치의 개략도를 나타내며, 질소로 가압된 챔버 내부에 100 MPa의 분사 압력으로 12 mg의 바이오디젤을 분사하여 초고속 카메라와 메탈-할라이드 램프를 통해 연료 분사율과 분무 관통 거리(Spray tip penetration) 데이터를 취득하였다.
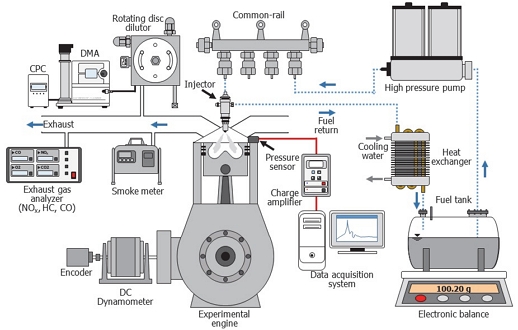
Fig. 4는 바이오디젤의 엔진 연소 실험 장치의 개략도를 나타내며, 엔진 연소 실험을 통해 IMEP, Soot 및 NOX 배출량과 같은 데이터를 취득하였다. 취득한 데이터는 본 연구에서 개발한 바이오디젤 축소 화학반응 메커니즘의 신뢰성 검증에 사용되었다.
4. 결과 및 고찰
4.1 연료 분무 특성
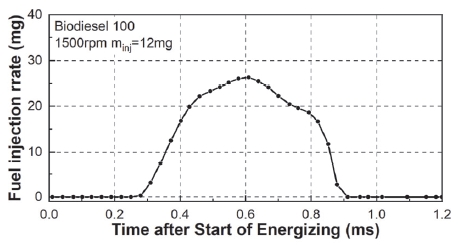
연료의 분무 특성은 Soot 생성에 큰 영향19)을 미치기 때문에 엔진 연소 해석에 앞서 분무 특성 검증이 선행되어야 한다. Fig. 5는 인젝터 통전 시작(SOE, Start of Energizing) 이후의 연료 분사율 나타내며, 취득한 연료 분사율 데이터는 3D CFD 해석에 동일하게 적용하였다.
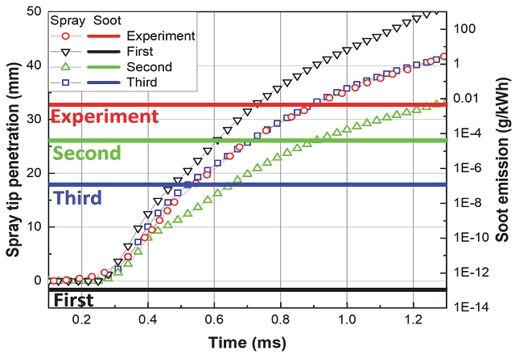
분무 관통 거리의 검증은 분무된 연료 액적의 미립화 및 분열 과정을 계산하는 KH-RT(Kelvin-Helmholtz and Rayleigh-Taylor) 분열 모델의 상수 변경을 통해 수행되었다. Table 3은 분무 관통 거리를 실험값과 검증하는 과정에서 사용된 KH-RT 상수들을 정리하였고 검증 과정에서 상수들의 변경은 실험값과 오차가 감소되는 방향으로 세 단계에 걸쳐 수행되었으며, 최종적으로 3차의 KH-RT 상수를 해석에 적용하였다.
Fig. 6은 분무 관통 거리 검증 과정에서 변경된 KH-RT 분열 모델의 상수 변화에 따른 분무 관통 거리의 변화 및 Soot의 생성량 결과를 나타낸다. 해석 결과, 분무 관통 거리가 증가할수록 Soot 생성량이 감소하는 결과를 보이지만, 분무 관통 거리가 실험 데이터와 가장 유사한 3차의 Soot 생성량은 실험 데이터와 일치하지 않는 결과가 나타났다. 이는 메커니즘 합성 및 커플링 과정에서 발생한 오차가 원인으로 판단된다.
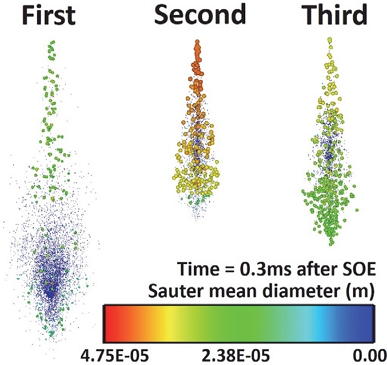
Fig. 7은 SOE 이후 0.3 ms 시점에서 바이오디젤 연료 액적의 미립화와 분열되는 모습을 나타내었다. Fig. 6에서 분무 관통 거리가 가장 높게 나타난 1차는 2차와 3차보다 분사된 연료 액적의 길이가 길고, 미립화된 결과가 나타났다. 연료의 미립화는 Soot 생성량을 감소시키기19) 때문에 분무 관통 거리가 증가할수록 Fig. 6과 같이 Soot의 생성량이 감소한 것으로 판단된다.
4.2 기존 해석 결과 분석
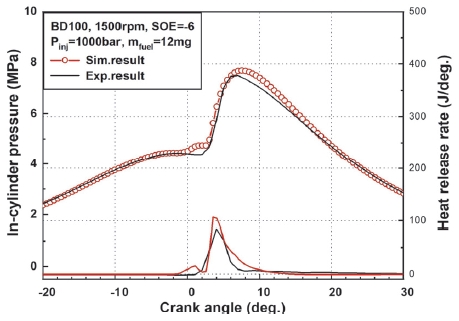
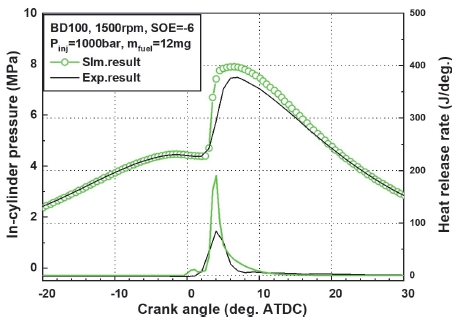
본 연구에서 사용된 바이오디젤 축소 화학반응 메커니즘은 선행 연구20)에서 NOX, IMEP 및 저온 영역의 점화지연 오차를 개선한 축소 화학반응 메커니즘이며, 해당 메커니즘을 사용하여 Fig. 8과 같이 실린더 압력 및 열 방출률과 Fig. 9와 같이 배기 배출물에 대한 기초 해석을 수행하여 실험값과 비교하였다.
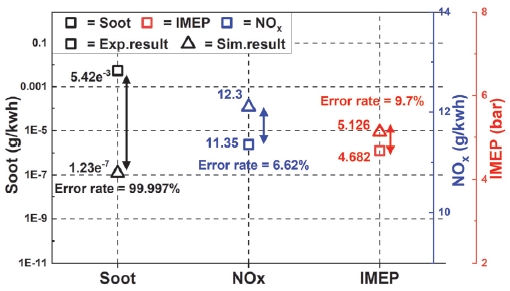
Result of experiment and simulation on soot, NOX and IMEP before improving the chemical reaction rate
해석 결과, 압력 및 열 방출률의 최고점이 실험 결과보다 약간 높게 나타나지만 7 % 이하의 오차가 발생하였고, NOX와 IMEP 오차는 각각 4.62 %와 9.7 %로 준수하지만, 메커니즘 합성 및 커플링된 Soot 생성량 오차율은 99.997 %로 크게 발생하였다.
4.3 화학반응 메커니즘의 오차 개선
일반적으로 메커니즘 축소로 인해 발생한 오차의 개선은 식 (1)과 같은 화학반응식인 Arrhenius equation의 수정을 통해 수행된다.
| (1) |
여기서, kfi는 화학반응속도 상수, A는 선지수함수 인자(Pre-exponential factor), Ru는 일반기체상수(Universal gas constant), b는 온도지수(Temperature exponent), EA는 활성화 에너지, T는 절대온도를 나타낸다. A, b, EA는 경험적 인자이며, 모든 반응식의 경험적 인자에 대한 정보는 Gas phase kinetic chemistry에 포함되어 있다.
이러한 Arrhenius 식을 통해 결정된 화학반응속도는 화학종의 생성/소멸을 결정하기 때문에 메커니즘 축소로 감소된 화학반응속도로 인한 오차를 개선하기 위해 사용된다. 화학반응속도를 증감시키기 위해 모든 경험적 인자를 사용하는 선행 연구도 있지만,21) 대부분의 연구자들은 선지수함수 A만을 사용하여 화학반응속도를 조절한다.11,12,22) 이러한 이유는 선지수함수 A는 다른 경험적 인자보다 화학반응속도에 지배적인 영향 미치기 때문에 직관적으로 오차의 수정이 가능하며, 모든 반응식을 사용할 경우, 화학반응속도 조절 과정에서 문제가 발생할 경우 원인 파악이 어렵기 때문이다.
선지수함수 인자 A의 수정은 화학반응속도상수 kfi에 영향을 미치기 때문에 선지수함수 인자의 수정이 과도하게 수행될 경우, 화학반응속도의 증가로 인해 Fig. 10과 같이 증가한 화학반응속도로 인하여 연료의 산화가 급격히 진행되어 실린더 압력이 가파르게 상승하고, 열 방출률이 증가하는 결과를 발생시킨다. 따라서, 본 연구에서는 실린더 압력과 열 방출률 오차를 주의하며, 선지수함수 인자의 수정을 통해 Soot 생성량 오차를 개선하였다.
4.4 Soot 오차 개선
메커니즘 합성을 통해 골격 메커니즘에는 없었던 PAHs 화학종의 반응 경로 분석이 가능하다는 장점이 있지만, 합성된 화학종과 반응식으로 인해 골격 메커니즘의 반응 경로가 변경되어 오차가 동반된다.
따라서, 메커니즘 합성 과정에서 발생한 오차를 분석하고, 개선하는 과정이 필요하다. 또한, 화염 표면에서의 Soot 생성의 계산을 위해 커플링된 Chou 등16)이 제시한 Soot surface 메커니즘 또한 골격 메커니즘에 적합하도록 화학반응속도의 최적화 과정이 필요하다. 따라서, 합성된 PAHs 반응식과 커플링된 Soot surface 반응식들의 최적화를 위해 선지수함수 인자의 수정을 통해 오차를 개선하였다.
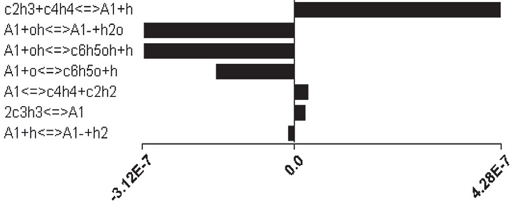
Fig. 11은 A1(Benzene, c6h6)의 반응 경로 분석을 결과를 나타낸다. 반응 경로 분석을 통해 A1화학종이 생성/소멸에 큰 영향을 미치는 화학종들을 선정하며, A1화학종 생성에 가장 큰 영향을 미치는 반응식은 c2h3+c4h4=A1+h으로 나타났다. A1이외의 PAH 화학종인 A2(Naphthalene, c10h8), A3(Phenanthrene, c14h10), 그리고 A4(Pyrene, c16h16)에 대해서도 반응 경로 분석을 수행하여 각 화학종에서 영향력이 높은 반응식을 2 ~ 3개씩 도출하여 총 13개의 반응식이 Soot 오차 개선을 위해 일차적으로 선정되었다.
일차적으로 선정된 13개의 반응식이 Soot 생성에 미치는 영향력을 비교하기 위해 선지수함수 인자를 변경에 따른 Soot 생성량 변화를 3D CFD 해석을 통해 분석하였다. 해석 결과, c4h5+A1=A2+h2+h 반응식이 Soot 생성에 가장 큰 영향을 미쳤으며 해당 반응식을 기준으로 Soot 생성에 미치는 영향력(ISG, Influence on Soot Generation)을 정규화(Normalization)하여 Table 4와 같이 정리하였다. 분석 결과를 바탕으로 Soot 오차 개선에 사용될 반응식으로 Table 4에서 ISG 값이 높은 반응식 중에서 실린더 압력 오차 발생률이 높은 7번 반응식을 제외하고 1 ~ 6번 반응식을 선정하였다.
반응 경로 분석으로 선정된 모든 반응식을 Soot 오차 개선 사용하지 않는 이유는 Fig. 10과 같이 과도한 화학반응속도 변경으로 인한 오차 발생 가능성이 증가하며, 오차 발생 시 원인 분석이 어렵기 때문이다.
Soot 계산을 위해 커플링된 Soot surface 메커니즘에 포함된 반응식은 7개로 비교적 개수가 적기 때문에 반응 경로 분석을 제외하고, 3D CFD 해석을 통해 Soot 생성에 미치는 영향력을 Table 5와 같이 모든 반응식에 대해 정리하였다.
Table 4와 동일하게 Soot 생성에 미치는 영향력이 가장 큰 Soot(s)+c2h2=h(s)+2c+h 반응식을 기준으로 영향력을 정리하였으며, 상위 4개의 반응식을 오차 개선에 사용하였다. 반응식에서 h(s)와 Soot(s) 화염 표면(Surface)에서 존재하는 h와 Soot 화학종을 의미한다.
Soot 오차를 개선하기 위해 선정된 PAHs 및 Soot surface 반응식들의 선지수함수 인자의 수정은 3번에 걸쳐 수행되었다. 이는 선지수함수 인자 수정 과정에서 Soot 생성량 변화를 분석하고, 과도한 화학반응속도의 증가로 인한 오차 방지를 위해서이다. Table 6은 PAHs 반응식과 선지수함수 인자의 수정 과정을 Table 7은 Soot surface 반응식과 선지수함수 인자의 수정 과정을 정리하였다.
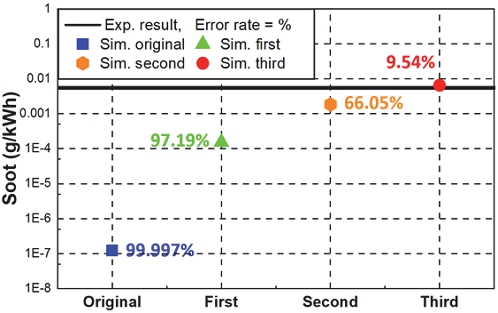
Table 6과 7의 선지수함수 인자의 수정 과정은 Fig. 12와 같이 Original 단계에서 99.97 %의 오차율을 갖던 Soot 생성량 오차를 감소시키는 방향으로 수행되어 Third 단계에서 9.54 %까지 오차율이 감소하였다.
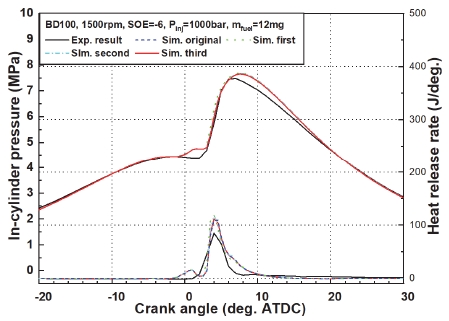
Fig. 13은 3번에 걸친 선지수함수 인자의 수정 과정에서 실린더 압력 및 열 방출률 변화를 정리하였으며, 기존 해석 결과인 Fig. 8과 비교하여 실린더 피크 압력과 점화지연의 오차가 1 % 감소하는 결과를 보였다. 이는, Soot의 오차 개선과정에서 합성된 메커니즘의 화학반응속도가 골격 메커니즘에 최적화되어 오차가 감소한 것으로 판단된다.
4.5 개선 메커니즘의 NOX 및 IMEP 결과
Fig. 14는 최종적으로 개발된 바이오디젤 축소 화학반응 메커니즘의 배기 배출물 및 IMEP 해석 결과를 나타낸다. 기존 해석 결과인 Fig. 9와 비교하여 NOX는 2.48 %, IMEP는 0.5 %의 오차가 감소하였다. 이는 실린더 압력과 동일하게 Soot의 오차 개선으로 인한 메커니즘의 화학반응속도 최적화되어 NOX와 IMEP에 영향을 미친 것으로 판단된다.
5. 결 론
본 연구에서는 3D CFD 해석에 최적화된 바이오디젤 축소 화학반응 메커니즘을 개발하기 위해 Soot 생성량 오차를 선지수함수 인자의 수정을 통해 개선하였다. 메커니즘의 개선은 3D CFD 해석을 통해 수행되었으며, 연구를 통해 다음과 같은 결론을 내렸다.
- 1) 분무 관통 거리의 검증을 통해 Soot 생성량이 기존 1.235 e-7g/kWh에서 5.82 e-7g/kWh으로 증가하였으며, 이를 통해 분무 관통 거리가 Soot 생성량에 큰 영향을 미치는 것을 확인하였다. 따라서, 3D CFD 연소 해석을 수행하기에 앞서 분무 관통 거리와 같은 분무 특성에 대한 검증이 선행되어야 한다.
- 2) 메커니즘 합성과 커플링으로 인해 골격 메커니즘에 최적화되지 않은 화학종과 반응식의 영향으로 Soot 생성량 오차가 발생하였다. 오차를 개선하기 위해 수행한 선지수함수 인자(화학반응속도)의 변경을 통해 Soot의 오차율은 99.997 %에서 9.54 %로 감소하였다.
- 3) 선지수함수 인자의 과도한 수정으로 인한 오차 발생을 최소화하기 위해 선지수함수 인자의 변경에 따른 실린더 압력 및 열 방출률 결과를 관찰한 결과, Soot은 오차 개선과정을 통해 실린더 피크 압력 오차와 점화지연 오차가 1 % 감소하였다. 이는 합성과 커플링된 반응식들의 화학반응속도가 골격 메커니즘에 최적화된 결과로 판단된다.
- 4) 선행 연구들에서 불가능하던 Soot/NOX의 동시 계산이 가능해짐에 따라, 다양한 엔진 연소 조건에서 Trade off 관계를 갖는 Soot/NOX 생성량과 반응경로 분석이 가능해졌으며, 이를 통해 엔진의 구동 조건에 따른 배기 배출물 저감 연구를 위한 수치해석적 연구에 사용 가능하다.
Acknowledgments
A part of this paper was presented at the KSAE 2023 Spring Conference
이 논문은 2023년도 정부(교육부)의 재원으로 한국연구재단의 지원을 받아 수행된 기초연구사업임(RS-2023-00248467).
References
-
M. V. Twigg, “Progress and Future Challenges in Controlling Automotive Exhaust Gas Emissions,” Applied Catalysis B: Environmental, Vol.70, Nos.1-4, pp.2-15, 2007.
[https://doi.org/10.1016/j.apcatb.2006.02.029]

-
L. Zhang, X. Ren and Z. Lan, “A Reduced Reaction Mechanism of Biodiesel Surrogates with Low Temperature Chemistry for Multidimensional Engine Simulation,” Combustion and Flame, Vol.212, pp.377-387, 2020.
[https://doi.org/10.1016/j.combustflame.2019.11.002]

-
A. K. Azad, M. G. Rasul, M. M. K. Khan, S. C. Sharma and M. M. K. Bhuiya, “Recent Development of Biodiesel Combustion Strategies and Modelling for Compression Ignition Engines,” Renewable and Sustainable Energy Reviews, Vol.56, pp.1068-1086, 2016.
[https://doi.org/10.1016/j.rser.2015.12.024]

-
W. Liu, R. Sivaramakrishnan, M. J. Davis, S. Som, D. E. Longman and T. F. Lu, “Development of a Reduced Biodiesel Surrogate Model for Compression Ignition Engine Modeling,” Proceedings of the Combustion Institute, Vol.34, No.1, pp.401-409, 2013.
[https://doi.org/10.1016/j.proci.2012.05.090]

-
C. K. Westbrook, C. V. Naik, O. Herbinet, W. Pitz, M. Mehl, S. M. Sarathy and H. J. Curran, “Detailed Chemical Kinetic Reaction Mechanisms for Soy and Rapeseed Biodiesel Fuels,” Combustion and Flame, Vol.158, No.4, pp.742-755, 2011.
[https://doi.org/10.1016/j.combustflame.2010.10.020]

-
S. M. Aceves, J. Martinez-Frias, D. L. Flowers, J. R. Smith, R. W. Dibble, J. F. Wright and R. P. Hessel, “A Decoupled Model of Detailed Fluid Mechanics Followed by Detailed Chemical Kinetics for Prediction of Iso-octane HCCI Combustion,” Journal of Fuels and Lubricants, Vol.110, pp.2135-2146, 2001.
[https://doi.org/10.4271/2001-01-3612]

-
O. Herbinet, W. J. Pitz and C. K. Westbrook, “Detailed Chemical Kinetic Oxidation Mechanism for a Biodiesel Surrogate,” Combustion and Flame, Vol.154, No.3, pp.507-528, 2008.
[https://doi.org/10.1016/j.combustflame.2008.03.003]

-
T. Lu and C. K. Law, “A Directed Relation Graph Method for Mechanism Reduction,” Proceedings of the Combustion Institute, Vol.30, No.1, pp.1333-1341, 2005.
[https://doi.org/10.1016/j.proci.2004.08.145]

-
J. L. Brakora, Y. Ra, R. D. Reitz, J. McFarlane and C. S. Daw, “Development and Validation of a Reduced Reaction Mechanism for Biodiesel-fueled Engine Simulations,” SAE International Journal of Fuels and Lubricants, Vol.1, No.1, pp.675-702, 2009.
[https://doi.org/10.4271/2008-01-1378]

-
X. Gao, S. Yang and W. Sun, “A Global Pathway Selection Algorithm for the Reduction of Detailed Chemical Kinetic Mechanisms,” Combustion and Flame, Vol.167, pp.238-247, 2016.
[https://doi.org/10.1016/j.combustflame.2016.02.007]

-
L. Zhang, X. Ren and Z. Lan, “A Reduced Reaction Mechanism of Biodiesel Surrogates with Low Temperature Chemistry for Multidimensional Engine Simulation,” Combustion and Flame, Vol.212, pp.377-387, 2020.
[https://doi.org/10.1016/j.combustflame.2019.11.002]

-
H. M. Ismail, H. K. Ng, S. Gan, T. Lucchini and A. Onorati, “Development of a Reduced Biodiesel Combustion Kinetics Mechanism for CFD Modeling of a Light-duty Diesel Engine,” Fuel, Vol.106, pp.388-400, 2013.
[https://doi.org/10.1016/j.fuel.2012.10.015]

-
Z. Luo, T. Lu, M. J. Maciaszek, S. Som and D. E. Longman, “A Reduced Mechanism for High-Temperature Oxidation of Biodiesel Surrogates,” Energy Fuels, Vol.24, No.12, pp.6283-6293, 2010.
[https://doi.org/10.1021/ef1012227]

-
J. W. Jung, Y. C. Lim and H. K. Suh, “A Study on the Mechanism Reduction and Evaluation of Biodiesel with the Change of Mechanism Reduction Factors,” Proceedings of the Institution of Mechanical Engineers, Part D: Journal of Automobile Engineering, Vol.234, No.14, pp.3398- 3413, 2020.
[https://doi.org/10.1177/0954407020931694]

-
H. Wang, Q. Jiao, M. Yao, B. Yang, L. Qiu and R. D. Retiz, “Development of an N-heptane/toluene/polyaromatic Hydrocarbon Mechanism and Its Application for Combustion and Soot Prediction,” International Journal of Engine Research, Vol.14, No.5, pp.434-451, 2013.
[https://doi.org/10.1177/1468087412471056]

- C. P. Chou, D. Hodson, M. V. Petrova and E. Meeks, “Modeling Soot Growth and Activity with Heterogeneous Kinetics and Method of Moments,” Proceedings of the 5th US Combustion Meeting, pp.2496-2520, 2007.
-
S. H. Park, S. H. Yoon, H. J. Kim and C. S. Lee, “Effect of the Spray-atomization Characteristics on the Nano Size Particle Exhaust Emissions Characteristics Using Biodiesel-Bioethanol Blended Fuels in a DI Diesel Engine with Common Rail Injection System,” ASME Internal Combustion Engine Division Spring Technical Conference, pp.67-76, 2009.
[https://doi.org/10.1115/ICES2009-76062]

- I. G. Park, Improvement of Reduced Chemical Kinetic Mechanism for 3D CFD Engine Simulation of Biodiesel Fuels, M. S. Thesis, Kongju National University, Cheonan, 2021.
-
L. M. Pickett and D. L. Siebers, “Soot in Diesel Fuel Jets: Effects of Ambient Temperature, Ambient Density, and Injection Pressure,” Combustion and Flame, Vol.138, Nos.1-2, pp.114-135, 2004.
[https://doi.org/10.1016/j.combustflame.2004.04.006]

-
Y. S. Song, Y. C. Lim, I. G. Park and H. K. Suh, “Improvement of Low-temperature Oxidation Reaction of Biodiesel Reduction Mechanism and Analysis of 3-D Engine,” Journal of The Korean Society Combustion, Vol.27, No.4, pp.29-39, 2022.
[https://doi.org/10.15231/jksc.2022.27.4.029]

-
P. Diévart, S. H. Won, S. Dooley, F. L. Dryer and Y. Ju, “A Kinetic Model for Methyl Decanoate Combustion,” Combustion and Flame, Vol.159, No.5, pp.1793-1805, 2012.
[https://doi.org/10.1016/j.combustflame.2012.01.002]

- Y. S. Song, C. H. Seo, J. G. Shin and H. K. Suh, “Optimization Study of Reduced Chemical Reaction Mexhanism for 3D CFD Analysis of Low-temperature Biodiesel Combustion,” KSAE Spring Conference Proceedings, p.152, 2023.
