동적 국부복사난방 조건에서 전기자동차 탑승자의 열쾌적감 측정 및 예측
Copyright Ⓒ 2023 KSAE / 212-01
This is an Open-Access article distributed under the terms of the Creative Commons Attribution Non-Commercial License(http://creativecommons.org/licenses/by-nc/3.0) which permits unrestricted non-commercial use, distribution, and reproduction in any medium provided the original work is properly cited.
Abstract
In cold winter, millage reduction issue of electric vehicles persists because the power consumption of the HVAC system needs to be increased to satisfy the thermal comfort of occupants. Radiant heating on local body parts, together with HVAC, can potentially enhance the occupants’ thermal comfort. Here, we hypothesized that periodic operation of local radiant warming could maintain comfort levels at less energy expenditure, according to the framework of spatial thermal alliesthesia. We conducted a real car experiment in a climate chamber with twelve male participants. Majority of subjects under periodic local radiant warming perceived an increase in thermal comfort with a 39 % reduction in energy consumption compared to continuous operation. Additionally, the paper presents a prediction model(MAE < 1.2) to integrate local subjective perception into overall values. These findings might have significant implications for reducing energy consumption and improving occupant comfort in electric vehicles during cold weather conditions.
Keywords:
Electric vehicle, Local radiant heating, Dynamic thermal perception, Thermal sensation, Thermal comfort, Skin temperature, Thermal alliesthesia, Environmental chamber키워드:
전기자동차, 국부복사난방, 동적 열지각, 한서감, 열쾌적감, 피부온도, 열감변화반응, 환경챔버1. 서 론
현대 사회에서 산업과 교통기술이 발달하면서 사람들은 하루 중 90 % 이상의 시간을 건물과 교통수단 등 밀폐된 실내 환경에서 보낸다.1) 그 중 자동차가 차지하는 비중은 증가하여 점차 교통수단을 넘어 또 다른 하나의 생활공간으로 인식되고 있다.
전기자동차 개발과 보급이 진행됨에 따라 대두되고 있는 문제는 전기자동차의 공조냉난방시스템(HVAC)과 에너지 효율성이다. 겨울철 주행 조건에서 차내 난방을 위해 공조냉난방시스템을 작동시키면 용량이 한정된 배터리의 전기에너지 소비가 급격히 증가하므로 전기자동차의 주행거리가 최대 40 %까지 감소하여 전기소비효율(전비)이 감소한다. 따라서 전기자동차의 전비를 유지하면서 탑승자의 열쾌적감을 만족시키는 고효율 난방 시스템 개발이 필요하다.2,3)
Bäuml 등4)은 전기자동차에서 적외선 복사난방의 효과를 연구했다. 차내 공기 온도를 높이기 위해 많은 시간과 에너지가 필요한 대류열전달 기반 공조냉난방시스템 난방과 달리 국부복사난방은 탑승자 피부로 복사열을 직접 전달하는 새로운 난방 방식이다. 국부복사난방은 공조냉난방시스템 방식에 비해 전기에너지 소비를 최대 50 %까지 감소시키는 것으로 보고됐다. 하지만 국부복사난방만으로 차내 공기 온도를 높이는 데 한계가 있기 때문에 탑승자 열쾌적감을 향상시키고자 적외선 워머와 공조냉난방시스템을 결합한 난방 방식이 제안됐다.
사람이 주변 열환경을 어떻게 인식하는지 이해하고자 그동안 진행된 연구5-8)를 살펴보면 시공간적으로 변화하는 열자극이 일정한 강도로 균일하게 가해지는 열자극보다 열쾌적감을 향상시킨다고 보고됐다.9) 열지각(Thermal perception)은 한서감(Thermal sensation)과 열쾌적감(Thermal comfort)의 두 가지 주요 요소로 구성된다. 한서감은 시원하다 또는 따뜻하다와 같이 사람이 주변 열환경을 어떻게 느끼는지에 대한 주관적인 평가로 간주된다. 열쾌적감은 열지각의 쾌락적 요소로 사람이 심적으로 주변 열환경에 얼마나 만족하는지를 나타낸다.
열자극은 열스트레스를 완화하는 능력에 따라 편안함 또는 불편함을 유발한다. 예를 들어 추운 겨울에 사람이 따뜻한 열환경에 오래 머무는 경우 초기에는 한서감이 증가함에 따라 열쾌적감도 높아지나, 점차 따뜻함을 넘어 덥다고 느끼게 되면 결국 열쾌적감이 감소하게 된다. 이러한 심리생리학적(Psychophysiological) 현상을 열감변화반응(Thermal alliesthesia)으로 정의한다.5-10) Kuno11)는 이러한 열감변화반응에 기초하여 불쾌함이 크고 오래 지속될수록 나중에 더 강한 열쾌적감을 유발한다는 연구 결과를 보고했다. 추운 환경에 오래 있다가 더운 환경으로 이동할 경우 이를 덥다고 느끼기보다는 따뜻하게 느껴 열쾌적감이 향상되는 예가 이에 해당한다.
본 연구에서는 공조냉난방시스템과 적외선 워머를 사용한 국부복사난방 시스템이 균일한 강도로 연속적으로 작동할 때는 앞서 언급한 열감변화반응에 의해 열쾌적감이 점차 불만족에 도달할 것이고, 적외선 워머가 일정한 주기로 켜지고 꺼지는 동적 작동 조건에서는 열감변화반응에 의한 불쾌감을 줄여서 보다 향상된 열쾌적감을 제공할 것이라는 가설을 검증하고자 한다. 이러한 가설 검증을 위해 겨울철 환경 조건이 구현된 실차 환경챔버 내에 위치한 전기자동차에 연구대상자가 탑승한 상태에서 공조냉난방시스템만 40분 동안 작동시키는 난방 조건 A(HVAC), 공조냉난방시스템과 적외선 워머를 일정한 출력으로 40분 동안 작동시키는 난방 조건 B(HVAC + IR warmer) 그리고 공조냉난방시스템을 50분, 적외선 워머를 8분 주기로 온오프 작동하는 난방 조건 C(HVAC + cycling IR warmer)에서 실험을 진행했다. 세 가지 난방 조건에서 측정한 연구대상자의 피부온도와 3분 간격으로 수집한 전신/국부 한서감 및 전신/상체/하체 열쾌적감 응답값 분석을 통해 난방 조건에 따른 탑승자의 한서감과 열쾌적감의 변화를 평가했다. 이를 통해 궁극적으로는 전기자동차의 전기에너지 소비를 절약하면서도 적절한 열쾌적감을 제공할 수 있는 동적 국부복사난방 시스템을 제안하고자 한다.
2. 실험 장치 및 방법
2.1 장치 구성
실차 환경챔버의 크기는 3.6×6.3×2.8 m3로 9인승 차량까지 입고 가능하다(Fig. 1(a)). 설정 가능한 환경온도 범위는 –30 ~ 50 °C이고 상대습도 범위는 30 ~ 80 %이다. 시험차량으로 현대자동차 전기자동차 모델 IONIQ 5를 대여하여 사용했고 상세 제원은 Table 1에 나타냈다. 국부복사난방을 위한 적외선 워머는 필름형으로 주문 제작하여 시험차량 내부 운전석과 조수석 주변에 부착했다.
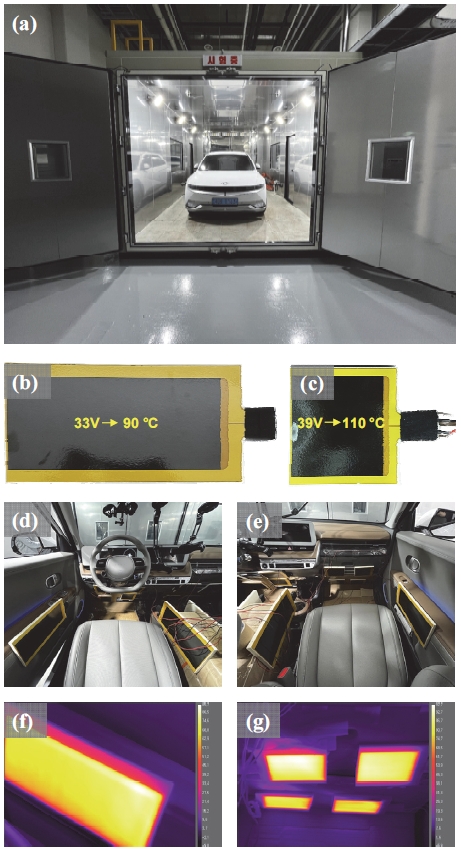
(a) Test electric vehicle in environment chamber, (b, c) Infrared radiant(IR) warmers with the area of 300 150 mm2(rectangle) and 150×150 mm2(square) (d, e) IR warmers installed around the driver and passenger seats(f, g) Thermal images of rectangular and square IR warmers
필름형 적외선 워머는 Fig. 1(b) 및 1(c)와 같이 300 × 150 mm2와 150 × 150 mm2 크기를 갖는 두 종류가 제작됐다.12) 직사각형 형태의 적외선 워머는 탑승자의 양쪽 허벅지 바깥면, 정사각형 형태의 적외선 워머는 탑승자의 무릎 전면, 정강이, 발을 가열하도록 설치됐다. Fig. 1(d)와 1(e)는 각각 운전석과 조수석 쪽에 부착된 적외선 워머 사진을 나타낸다. 직사각형 적외선 워머는 탑승자의 허벅지로부터 약 10 cm, 정사각형 적외선 워머는 무릎 전면으로부터 약 30 cm 떨어진 것을 고려해 각각 33 V 및 39 V 전압을 가해서 적외선 워머 표면의 평균 온도가 각각 90 °C 및 110 °C에 도달하도록 설정했다. Fig. 1(f)와 1(g)는 적외선 워머 표면을 열화상 카메라로 촬영한 이미지를 나타낸다.
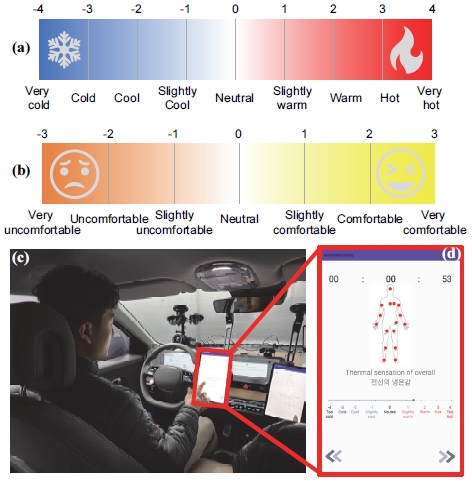
연구대상자의 전신/국부 한서감과 전신/국부 열쾌적감은 각각 Fig. 2(a)에 나타낸 9점 척도를 따라 매우 추움의 -4단계부터 매우 더움의 4단계, Fig. 2(b)와 같은 7점 척도를 따라 매우 불만족의 -3단계부터 매우 만족의 3단계까지 0.5 단위로 응답을 기록했다. 그리고 평소 따뜻함과 시원함 중 어느 것을 선호하는지를 파악하고자 열환경 선호도 응답을 수집했다. 공조냉난방시스템을 작동한 시점을 기준으로 한서감/열쾌적감을 3분 간격으로 응답받았다. 연구대상자의 응답을 실시간으로 신속하게 수집하여 기록하고자 Fig. 2(c) 및 2(d)와 같이 자체 개발한 안드로이드 애플리케이션을 태블릿 PC 두 대에 설치하여 활용했다.
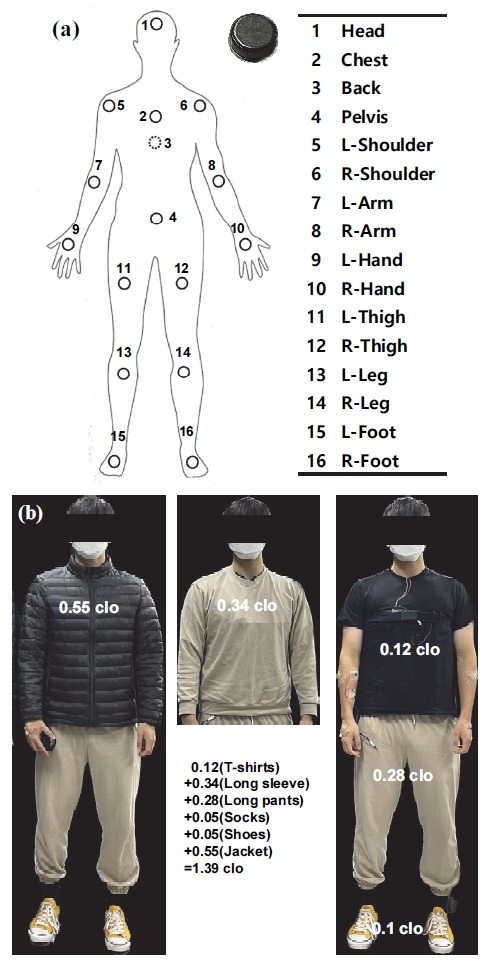
피부온도를 측정하고자 iButton 온도센서(DS1922L/DS1925, Maxim Integrated)를 Fig. 3(a)와 같이 16개 신체 부위 피부에 의료용 테이프(Micropore, 3M)를 이용하여 부착했다. 온도 측정 간격은 센서 종류에 따라 1분(DS1922L) 또는 3분(DS1925)으로 설정했다. 난방 조건에 따라 피부온도가 상대적으로 빠르게 변화할 것으로 예상되는 하체 부위와 몸의 중심부인 가슴에 DS1922L 센서를 사용했고 나머지 부위에는 DS1925 센서를 사용했다.
2.2 실험 방법
연구대상자로 심장혈관, 호흡기 또는 열과 관련된 질병이나 증상이 없는 만 19세 ~ 27세 남자 12명을 모집했으며 모든 연구대상자가 세 가지 난방 조건 실험에 참여했다. 연구대상자는 Fig. 3(b)와 같이 반팔 티셔츠, 트레이닝복 상의/하의 세트, 경량 패딩을 실험복으로 착용했다. 실험복은 총 1.39 clo(반팔 0.12 + 긴팔 상의 0.34 + 긴 바지 0.28 + 양말 0.55 + 신발 0.05 + 경량 패딩 0.05 = 1.39)의 보온력을 지닌다. 본 연구는 국민대학교 생명윤리위원회의 승인(KMU-202206-HR-319)을 받아 규정에 따라 진행했다.
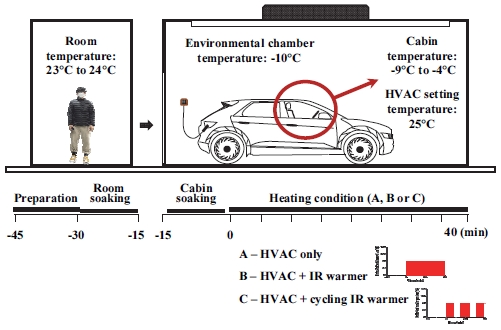
연구대상자는 실험준비실에 도착한 후 15분 동안 실험복으로 갈아입고 각종 센서를 신체에 부착한 상태에서 15분 동안 상온환경(20 ~ 25 °C)에서 대기했다. 이후 -10 °C로 설정된 환경챔버 내 전기자동차에 탑승했다. 이때 차내 온도는 -9 °C에서 -4 °C까지로 유지되었고 15분 후에 공조냉난방시스템을 설정온도 25 °C, 바람세기 3단으로 고정한 상태에서 공조냉난방시스템 단독으로 또는 적외선 워머와 동시에 작동시켜 세 가지 난방 조건에서 실험을 진행했다. 실험에 소요되는 시간은 A와B 난방 조건에서는 40분으로 설정했고 C 난방 조건에서는 8분 주기의 온오프 동적 제어가 총 3회 반복되도록 50분으로 설정했다. 실험 절차와 환경챔버 설정 온도 및 난방 조건을 Fig. 4에 도식적으로 나타냈다.
3. 결과 및 고찰
3.1 측정 결과
Hardy와 Du Bois14)는 신체 부위별로 다른 열민감도와 피부 면적을 고려하여4) 7점 가중치 평균 피부온도(Mean skin temperature; MST) 식을 다음과 같이 제안했다.
| (1) |
본 실험에 참여한 연구대상자의 국부 피부온도 측정값을 이용하여 각 연구대상자의 평균 피부온도를 구했다. 세 가지 난방 조건에서 연구대상자 12명의 평균 피부온도 변화를 Fig. 5에 연한 컬러선으로 나타냈다. 굵은 검정색 선은 모든 연구대상자의 평균 피부온도 평균값을 나타낸다. Fig. 5(a)~(c)에 도시한 각 난방 조건에서 평균 피부온도 평균값의 최대 증가치는 각각 1.8, 3.1, 3.3이다. 이는 적외선 워머가 공조냉난방시스템 단독 난방 조건에 비해 평균 피부온도를 1.7배 이상 증가시키는 효과가 있음을 의미한다.
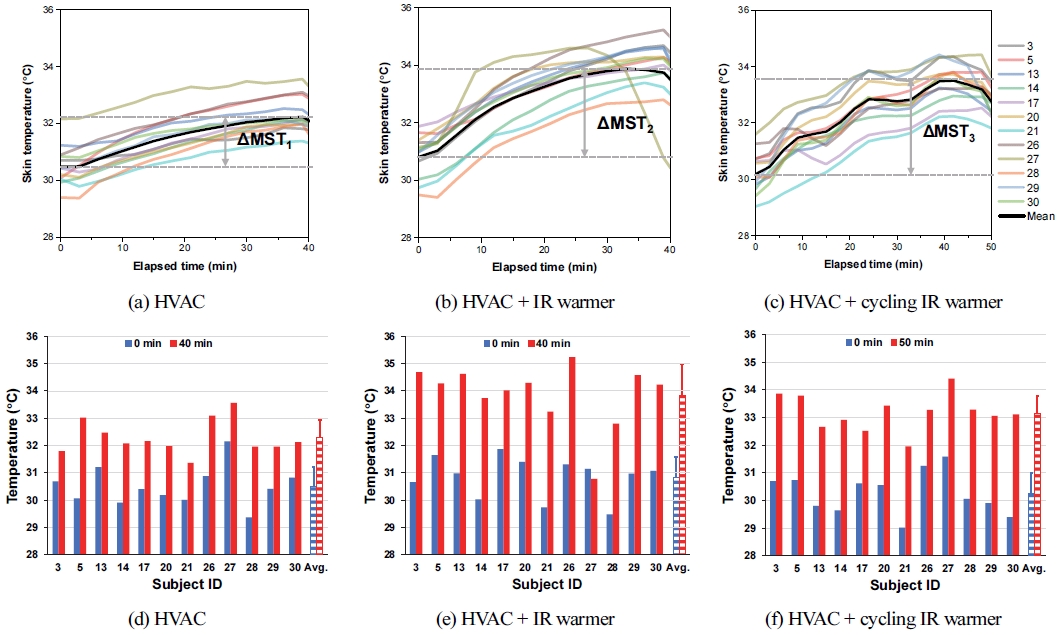
Variations of mean skin temperatures(MSTs) of 12 subjects for 40 min under three heating conditions(upper panel). Distributions of MSTs in 16 body parts averaged for 12 subjects at 0 min and 40 min under three heating conditions(lower panel). (a, d) HVAC (b, e) HVAC + IR warmer (c, f) HVAC + cycling IR warmer
Fig. 5(d)~(f)에 막대그래프로 나타낸 모든 연구대상자의 평균 피부온도 변화를 보면 난방 조건 A(HVAC)에서 평균 피부온도가 33 °C 이상에 도달한 인원은 총 12명 중 3명에 불과하고 나머지 9명의 평균 피부온도는 32.5도 이하로 측정됐다. 난방 조건 B(HVAC + IR Warmer)에서는 2명을 제외한 10명의 평균 피부온도가 33 °C 이상에 도달했고 그 중 8명은 34 °C 이상에 도달했다. 난방 조건 C(HVAC + cycling IR Warmer)에서는 9명의 평균 피부온도가 32.5 ~ 33.5 °C 범위에 도달했고 1명은 34 °C 이상, 다른 1명은 32 °C에 도달했다.
세 가지 난방 조건에서 연구대상자 12명의 전신 한서감(Overall thermal sensation; OTS) 변화를 Fig. 6에 연한 컬러선으로 나타냈다. 굵은 검정색 선은 모든 연구대상자의 전신 한서감 평균값을 나타낸다. Fig. 6(a)~(c)에 도시한 각 난방 조건에서 평균 전신 한서감의 최대 증가치은 각각 3.7, 4.2, 4.1이고 최대값은 각각 1.2, 1.8, 1.4이다. 이 결과로부터 적외선 워머가 공조냉난방시스템 단독 난방 조건에 비해 전신 한서감을 약 10 % 증가시키는 효과가 있음을 알 수 있다.
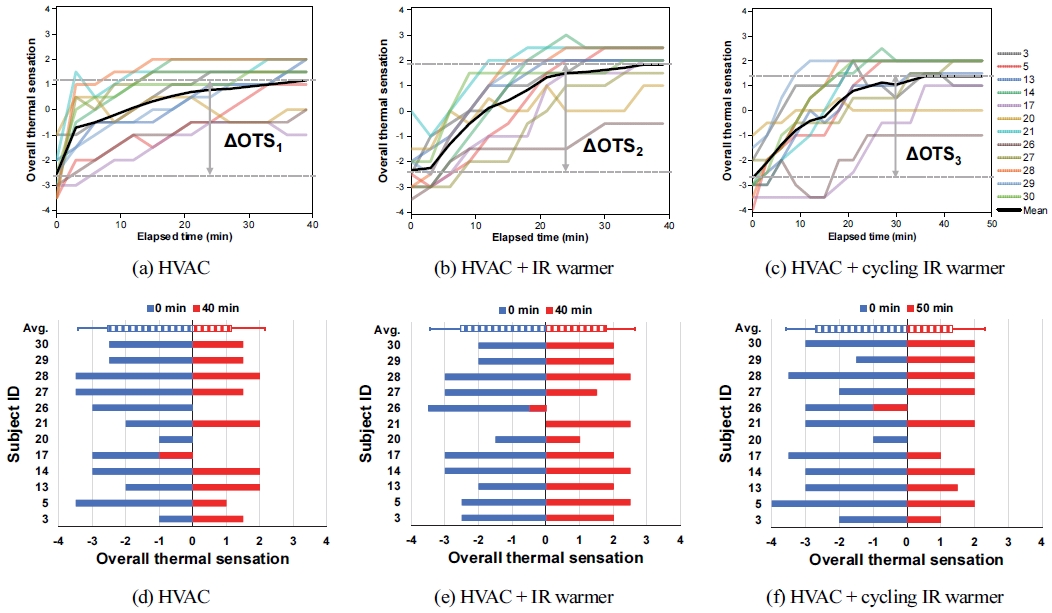
Variations of overall thermal sensation of 12 subjects for 40 min under three heating conditions(upper panel). Distributions of overall thermal sensation for 12 subjects at 0 min and 40 min under three heating conditions(lower panel). (a, d) HVAC (b, e) HVAC + IR warmer (c, f) HVAC + cycling IR warmer
Fig. 6(d)~(f)에 막대그래프로 나타낸 모든 연구대상자의 전신 한서감 변화를 보면 난방 조건 A와 C에서 2단계(따뜻함)를 최대값으로 응답한 인원은 총 12명 중 각각 4명과 7명이다. 난방 조건 B에서는 9명이 2단계 이상의 전신 한서감을 응답했고 그 중 4명은 2.5단계를 최대값으로 응답했다. 이를 통해 적외선 워머를 주기적으로 온오프 작동시키는 난방 조건 C에 비해 일정한 출력으로 작동시키는 난방 조건 B에서 보다 많은 인원이 따뜻함을 넘어 다소 덥게 느끼는 경향을 확인할 수 있다.
세 가지 난방 조건에서 연구대상자 12명의 전신 열쾌적감(Overall thermal comfort; OTC) 변화를 Fig. 7에 연한 컬러선으로 나타냈다. 굵은 검정색 선은 모든 연구대상자의 전신 열쾌적감 평균값을 나타낸다. Fig. 7(a)~(c)에 도시한 각 난방 조건에서 평균 전신 열쾌적감의 최대 증가치는 각각 2.7, 2.7, 3.5이다. 이로부터 난방 조건 C가 다른 두 난방 조건에 비해 전신 열쾌적감을 약 30 % 이상 증가시키는 효과가 있다는 것을 알 수 있다. 각 난방 조건에서 평균 전신 열쾌적감이 중립상태인 0단계에 도달하는데 소요되는 시간은 각각 12분, 8분, 11분으로 이는 연구대상자의 전신 열쾌적감이 B 난방 조건에서 다른 두 난방 조건에 비해 보다 빠르게 중립에 도달한다는 것을 의미한다.
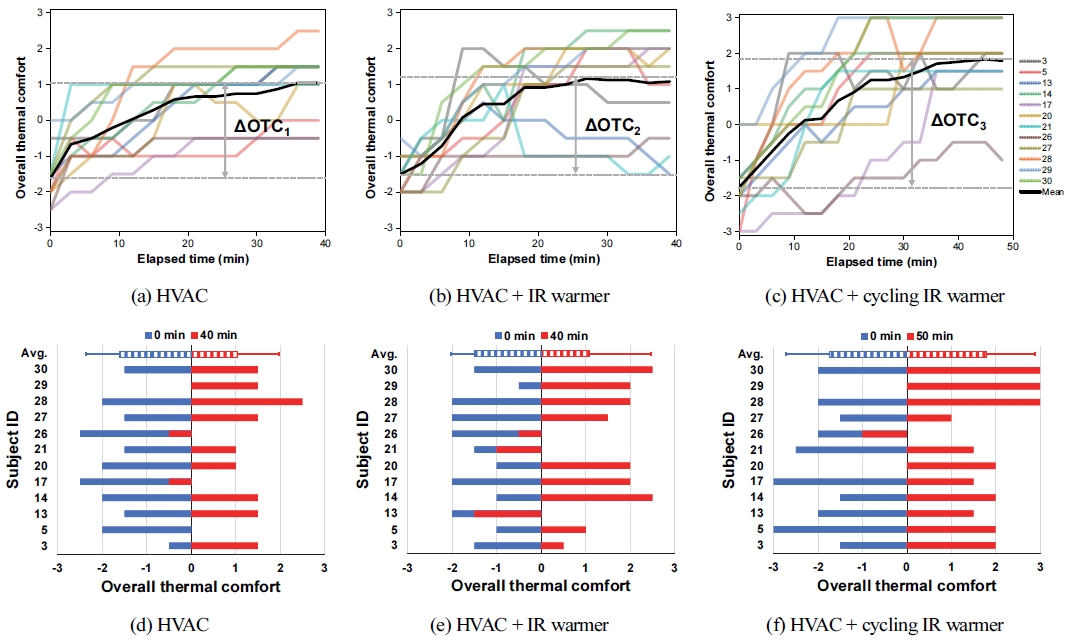
Variations of overall thermal comfort of 12 subjects for 40 min under three heating conditions(upper panel). Distributions of overall thermal comfort for 12 subjects at 0 min and 40 min under three heating conditions(lower panel). (a, d) HVAC (b, e) HVAC + IR warmer (c, f) HVAC + cycling IR warmer
Fig. 7(d)~(f)에 막대그래프로 나타낸 모든 연구대상자의 전신 열쾌적감 변화를 보면 난방 조건 A에서 열적으로 쾌적함에 해당하는 2단계 이상을 응답한 연구대상자는 12명 중 단 1명에 불과하나 난방 조건 B에서는 6명, C에서는 7명이 2단계 이상을 응답하여 적외선 워머가 작동한 경우 과반수가 쾌적한 상태에 도달했음을 알 수 있다. 특히 연구대상자 14번, 17번, 26번, 27번을 제외한 나머지 8명은 난방 조건 B에 비해 C에서 열쾌적감이 증가했다.
연구대상자의 전신 한서감과 전신 열쾌적감 응답값을 종합적으로 살펴보면 공조냉난방시스템과 적외선 워머를 결합한 난방 조건 B과 C은 공조냉난방시스템 단독 난방 조건 A에 비해 전신 한서감을 증가시키는 효과가 있으나 적외선 워머를 일정한 출력으로 작동시키는 난방 조건 B에서는 따뜻함을 응답한 연구대상자의 절반 정도가 실험 후반부에 약간 덥다는 응답을 했다(Fig. 6(b) 및 6(e)). 결과적으로 난방 조건 B에서는 평균 전신 열쾌적감이 약간 쾌적함(1단계)에서 쾌적함(2단계)으로 계속 증가하지 못하고 후반부에 오히려 약간 감소하는 경향(Fig. 7(b))을 보이는 반면 난방 조건 C에서는 평균 전신 열쾌적감이 중립에 도달한 후 지속적으로 증가하여 쾌적함에 해당하는 2단계에 가까이 도달하는 경향(Fig. 7(c))을 보였다. 이러한 결과는 사람의 열감변화반응을 고려한 동적 국부복사난방 조건에서 열쾌적감이 향상될 것이라는 가설을 뒷받침한다.
본 실험에서 공조냉난방시스템을 바람세기 3단, 설정온도 25 °C로 고정하여 40분 동안 작동시키면 약 1.55 kWh의 전력이 소비된다. 적외선 워머를 일정한 출력으로 40분 동안 작동시키면 공조냉난방시스템 전력 소비량의 15 % 정도인 0.23 kWh의 전력이 소비된다. 따라서 난방 조건 A, B, C에서 전력 소비량은 각각 1.55, 1.78, 1.67 kWh로 추정할 수 있다. 공조냉난방시스템을 최대 강도인 바람세기 8단, 설정온도 27 °C로 설정하여 40분 동안 작동시키면 2.71 kWh의 전력이 소비된다. 이를 기준으로 난방 조건 A, B, C에서 상대적인 전력 소비량은 각각 57 %, 66 %, 61 %이다. 따라서 공조냉난방시스템을 설정 가능한 최대 출력으로 작동시킬 때 난방 조건 C과 동등한 열쾌적감을 제공한다고 가정한다면 적외선 워머의 동적 제어를 통해 전력 소비량을 약 39 % 절감할 수 있다. 난방 조건별 상세 전기 소비량과 상대 에너지 소비율을 Table 2에 정리했다.
3.2 열심리 예측 모델
대표적인 한서감 및 열쾌적감 예측 모델로는 미국 캘리포니아 버클리대학의 Zhang 등15-18)이 개발한 UC Berkeley 모델을 들 수 있다. 이 모델은 -4에서 4 범위의 9점 Lickert 척도를 활용하여 전신뿐만 아니라 개별 신체 부위에 대한 한서감과 열쾌적감을 계산한다. 사람의 열심리의 부분적인 요소와 전체적인 요소 사이 연관성을 명확하게 정립한 연구는 아직 보고되지 않았으나 UC Berkeley 모델의 일부 요소에 본 연구의 실험 조건을 반영하여 실제 전기자동차 환경에서 연구대상자 12명의 국부/전신 한서감/열쾌적감을 예측하도록 확장시켰다. 시트에 앉아서 실험에 참여하는 연구대상자의 열심리 반응을 예측하고자 국부 인식 모델과 전신 인식을 위한 가중 평균 접근 방식을 활용했다. 모든 예측 모델 식의 계수는 MATLAB 내장 함수인 Fmincon을 사용해 결정했다.
연구대상자의 국부 한서감은 국부 및 평균 피부온도, 피부온도 및 심부온도의 시간변화율의 함수로 다음 식 (2)와 같이 나타낼 수 있다.15)
| (2) |
여기서 로 정의된다. 식 (2)에서 LTSi는 각 신체 부위의 국부 한서감이고, Tskin.i와 Tcore는 각각 국부 피부온도 및 심부온도, Tskin.set.i는 국부 피부온도 셋포인트18)값, 그리고 은 7점 가중치 평균 공식14)에 의해 계산된 평균 피부온도이다.
는 Tanabe 실험19)의 모델에서 평균 피부온도가 34 °C 일 때 일반적인 국부 피부온도를 셋포인트로 정한 온도이고 그 값은 부록의 Table A1에 정리되어 있다. 계수 c1은 각 신체 부위가 추운지(LTSi ≤ 0) 또는 따뜻한지(LTSi > 0)에 따라 c11 또는 c12로 식에 적용된다. 마찬가지로 계수 k1과 c2는 식에 맞는 회귀 계수를 갖는다. 세 가지 난방 조건 A, B, C에 대한 각 계수 c1, k1, c2, c3은 부록의 Table A2에 정리되어 있다.
신체 각 부위 한서감과 전신 한서감은 서로 영향을 미친다. 국부 한서감에 기반한 전신 한서감 예측 모델을 개발하고자 식 (3)과 같이 가중 평균 접근 방식을 사용됐다.
| (3) |
여기서 회귀 계수 ci는 세 가지 난방 조건에서 LTSi ≤ 0 또는 LTSi > 0일 경우 각각 c1 또는 c2가 적용되고 그 값은 부록의 Table A3에 정리되어 있다.
Zhang 등16)은 다음과 같이 국부/전신 한서감의 함수로 조정이 가능한 국부 열쾌적감 모델 식 (4)를 제안했다.
| (4) |
여기서 LTCi는 각 신체 부위의 국부 열쾌적감이다. 회귀 계수 c31, c32, c6, c71, c72, c8 및 n은 세 가지 난방 조건에 따라 달라지고 그 값은 부록의 Table A4에 정리되어 있다.
모든 신체 부위는 전신 열쾌적감에 영향을 준다. 일부 국부 열쾌적감은 편안함을 유도하는 반면 다른 부분은 불편함을 유도한다. 이를 바탕으로 국부 열쾌적감에 기반한 전신 열쾌적감 예측 모델을 개발하고자 다음 식 (5)와 같이 가중 평균 접근 방식을 적용했다.
| (5) |
여기서 회귀 계수 ci는 세 가지 난방 조건에서 LTCi ≤ 0 또는 LTCi > 0일 때 각각 c1 또는 c2로 적용되고 부록의 Table A5에 정리되어 있다.
예측 모델의 정확도 여부를 평가하고자 해당 모델의 전신 한서감/열쾌적감 예측값과 측정값을 비교하여 구한 평균 절대 오차(Mean absolute error; MAE)를 Table 3에 나타냈다. 전체적으로 MAE가 1.2 미만인 정확도를 갖는 예측 모델임을 확인할 수 있다.

Mean absolute error (MAE) of overall thermal sensation (OTS) and comfort (OTC) under three heating conditions
부록의 Table A3에 정리한 전신 한서감 모델의 가중 계수를 살펴보면 모든 신체 부위가 따뜻함을 느끼는 경우(LTSi > 0), 세 가지 난방 조건에서 모든 신체 부위는 동일한 가중 계수를 갖는다. 이는 적외선 워머에 의한 국부 복사난방 조건과 상관없이 16개 신체 부위의 국부 한서감은 전신 한서감에 동등하게 기여한다는 것을 의미한다. 모든 신체 부위가 추위를 느끼는 경우(LTSi ≤ 0)에는 국부적으로 열자극이 가해지는 신체 부위가 전신 한서감에 기여하는 정도가 크다.
부록의 Table A5에 정리한 전신 열쾌적감 모델의 가중 계수를 살펴보면 상체와 하체가 모두 쾌적함을 느끼는 경우(LTCi > 0), 신체 부위별 가중 계수는 난방 조건에 상관없이 동일한 값을 가지며 이는 상체 및 하체가 전신 열쾌적감에 동등하게 기여한다는 것을 의미한다. 상체와 하체가 불쾌함을 느끼는 경우(LTCi ≤ 0)에 신체 부위별 가중 계수는 난방 조건이 A에서 B와 C로 변동함에 따라 상체에서 하체 부분으로 증가하는 것을 확인할 수 있다.
추운 환경에 노출되었을 때 어느 특정 부위에 열을 가하는 것은 개인 온열감성에 중요한 지표가 된다. 이를 확인하기 위해서는 방대한 실험을 통한 열쾌적성 평가 작업이 필요하다. 하지만 본 논문에서 제안한 열쾌적성 예측 모델의 정확도를 개선한다면 실험에 의존하지 않고 피부온도에 기반한 시뮬레이션을 통해 다양한 동적 난방 조건에서 탑승자의 주관적인 온열감성을 예측하여 최적의 난방 제어 조건을 도출하는데 활용할 수 있을 것이다.
중앙집중식 공조냉난방시스템은 재실자들의 다양한 열적 선호도를 고려하여 국부적으로 실내온도를 제어할 수 없으므로 한 공간에 있는 모든 재실자의 열쾌적감을 만족시킬 수 없다.20) 열쾌적감은 심부 체온과 직접적인 상관관계가 있으며 근적외선 영상 기술을 사용하여 비침습적으로 추정할 수 있다.21) 손목, 다리, 허벅지, 가슴, 등, 얼굴22-24), 이마25) 등 다양한 신체 부위의 피부온도26-30) 및 심박수31-33)를 기록하기 위한 웨어러블 센서는 현재 열쾌적 모델링23,24,34-36) 및 열영상에서 구현되고 있다. 추가 연구를 통해 심전도, 맥박수, 호흡수, 피부전도도와 같은 생체신호를 측정하여 결과 분석을 통해 열쾌적감 수준별 차이를 보이는 생체 신호를 하나의 영향 요소로 추가하고 이것을 예측 모델에 적용하여 정확도를 높일 수 있다. 이와 같이 주행 중에 비접촉식 방식으로 한서감 및 쾌적감을 실시간으로 모니터링할 수 있다면 개별 탑승자의 상태에 맞춰 국부복사난방 시스템의 동적 제어를 통해 전기에너지를 절약하면서 열쾌적감을 향상시킬 수 있을 것으로 기대된다.37)
4. 결 론
본 연구를 통해 얻은 결과는 다음과 같이 요약할 수 있다.
- 1) 세 가지 난방 조건(A: HVAC, B: HVAC + IR warmer, C: HVAC + cycling IR warmer)에서 연구대상자 12명의 피부온도 및 열심리 측정 결과를 비교해보면 적외선 워머는 평균 피부온도, 평균 전신 한서감, 평균 전신 열쾌적감을 증가시키는 효과가 있다.
- 2) 공조냉난방시스템을 단독으로 작동시킨 난방 조건 A보다 적외선 워머를 함께 작동시킨 난방 조건 B와 C에서 과반수 이상의 더 많은 연구대상자가 2단계 이상의 전신 한서감(따뜻함)과 전신 열쾌적감(만족함)을 응답했다.
- 3) 적외선 워머의 출력을 동적으로 온오프 제어한 경우(난방 조건 C)에는 일정한 출력으로 작동시킨 경우(난방 조건 B)에 비해 연구대상자 중 과반수 이상(7명/12명)의 전신 열쾌적감이 증가했다. 이를 통해 동적 국부복사난방 조건(난방 조건 C)에서 열감변화반응으로 인해 열쾌적감이 향상될 것이라는 가설을 검증했고 전력 소비량은 최대 39 % 절감할 수 있음을 확인했다.
- 4) 전신 한서감/열쾌적감 예측 절대 오차가 1.2 미만인 피부온도 기반의 열심리 모델을 개발했다. 향후 탑승자의 온열감성을 예측하여 최적의 동적 국부복사난방 제어 전략을 도출하는데 활용할 수 있다.
Nomenclature
| Thead : | skin temperature of head, °C |
| Tarms : | average skin temperature of arms, °C |
| Thands : | average skin temperature of hands, °C |
| Tfeet : | average skin temperature of feet, °C |
| Tlegs : | average skin temperature of legs, °C |
| Tthighs : | average skin temperature of thighs, °C |
| Ttrunk : | average skin temperature of chest, back and pelvis, °C |
| Tskin,i : | local skin temperature in each body part, °C |
| Tcore : | body core temperature, °C |
| Tskin,set,i : | local skin setpoint temperature, °C |
| : | mean skin temperature, °C |
| : | setpoint for mean skin temperature, °C |
| LTSi : | local thermal sensation in each body part |
| OTS : | overall thermal sensation |
| LTCi : | local thermal comfort in each body part |
| OTC : | overall thermal comfort |
| cj : | regression coefficients |
| kj : | regression coefficients |
Subscripts
| i : | number assigned to each body part |
| j : | number assigned to each regression coefficient part |
Acknowledgments
A part of this paper was presented at the KSAE 2022 Fall Conference and Exhibition
본 연구는 정부(과학기술정보통신부)의 재원으로 한국연구재단의 지원(NRF-2022R1A4A5018891)과 산업통상자원부 및 산업기술평가관리원(KEIT)의 연구비 지원(1415177965/20011377; 1415178801/20014904)을 받아 수행된 연구임. 안드로이드 애플리케이션을 개발한 손호준 연구원에게 감사드립니다.
References
-
G. N. Bratman, J. P. Hamilton and G. C. Daily, “The Impacts of Nature Experience on Human Cognitive Function and Mental Health,” Annals of the New York Academy of Sciences, Vol.1249, No.1, pp.118-136, 2012.
[https://doi.org/10.1111/j.1749-6632.2011.06400.x]

-
Y. Mao, J. Wang and J. Li, “Experimental and Numerical Study of Air Flow and Temperature Variations in an Electric Vehicle Cabin During Cooling and Heating,” Applied Thermal Engineering, Vol.137, pp.356-367, 2018.
[https://doi.org/10.1016/j.applthermaleng.2018.03.099]

-
B. H. Kang and H. J. Lee, “A Review of Recent Research on Automotive HVAC Systems for EVs,” International Journal of Air-Conditioning and Refrigeration, Vol.25, No.4, p.11, 2017.
[https://doi.org/10.1142/S2010132517300038]

-
T. Bäuml, D. Dvorak, A. Frohner and D. Simic, “Simulation and Measurement of an Energy Efficient Infrared Radiation Heating of a Full Electric Vehicle,” 2014 IEEE Vehicle Power and Propulsion Conference, VPPC 2014, 2015.
[https://doi.org/10.1109/VPPC.2014.7007129]

-
T. Parkinson and R. De Dear, “Thermal Pleasure in Built Environments: Physiology of Alliesthesia,” Building Research and Information, Vol.43, No.3, pp.288-301, 2015.
[https://doi.org/10.1080/09613218.2015.989662]

-
Y. He, T. Parkinson, E. Arens, H. Zhang, N. Li, J. Peng, J. Elson and C. Maranville, “Creating Alliesthesia in Cool Environments Using Personal Comfort Systems,” Building and Environment, Vol.209, Paper No.108642, 2022.
[https://doi.org/10.1016/j.buildenv.2021.108642]

-
T. Parkinson and R. De Dear, “Thermal Pleasure in Built Environments: Spatial Alliesthesia from Contact Heating,” Building Research and Information, Vol.44, No.3, pp.248-262, 2016.
[https://doi.org/10.1080/09613218.2015.1082334]

-
T. Parkinson and R. de Dear, “Thermal Pleasure in Built Environments: Spatial Alliesthesia from Air Movement,” Building Research and Information, Vol.45, No.3, pp.320-335, 2017.
[https://doi.org/10.1080/09613218.2016.1140932]

-
M. Vellei, R. de Dear, C. Inard and O. Jay, “Dynamic Thermal Perception: a Review and Agenda for Future Experimental Research,” Building and Environment, Vol.205, Paper No.108269, 2021.
[https://doi.org/10.1016/j.buildenv.2021.108269]

-
M. Cabanac, “Sensory Pleasure,” The Quarterly Review of Biology, Vol.54, pp.1-59, 1979.
[https://doi.org/10.1086/410981]

- S. Kuno, “Comfort and Pleasantness,” Proceedings of the Pan-Pacific Symposium on Building and Urban Environmental Conditioning in Asia 2, pp.383-392, 1997.
- S. E. Yoon, G. Gopi, M. Fakhrulrezza, H. Lee and J. K. Kim, “Simulation and Prediction of Thermal Comfort of Occupants in Electric Vehicle under Dynamic Local Radiant Heating Conditions,” KSAE Fall Conference Proceedings, pp.2430-2431, 2022.
- HYUNDAI MOTOR COMPANY, Specifications of IONIQ 5, https://www.hyundai.com/content/dam/hyundai/kr/ko/data/vehicles/catalog/en/ioniq5-catalog-eng.pdf, , Accessed March 2023.
-
J. D. Hardy and E. F. Du Bois, “The Technic of Measuring Radiation and Convention,” The Journal of Nutrition, Vol.15, No.5, pp.461-475, 1938.
[https://doi.org/10.1093/jn/15.5.461]

-
H. Zhang, E. Arens, C. Huizenga and T. Han, “Thermal Sensation and Comfort Models for Non-Uniform and Transient Environments: Part I: Local Sensation of Individual Body Parts,” Building and Environment, Vol.45, No.2, pp.380-388, 2010.
[https://doi.org/10.1016/j.buildenv.2009.06.018]

-
H. Zhang, E. Arens, C. Huizenga and T. Han, “Thermal Sensation and Comfort Models for Non-Uniform and Transient Environments, Part II: Local Comfort of Individual Body Parts,” Building and Environment, Vol.45, No.2, pp.389-398, 2010.
[https://doi.org/10.1016/j.buildenv.2009.06.015]

-
H. Zhang, E. Arens, C. Huizenga and T. Han, “Thermal Sensation and Comfort Models for Non-Uniform and Transient Environments, Part III: Whole-Body Sensation and Comfort,” Building and Environment, Vol.45, No.2, pp.399-410, 2010.
[https://doi.org/10.1016/j.buildenv.2009.06.020]

-
Y. Zhao, H. Zhang, E. A. Arens and Q. Zhao, “Thermal Sensation and Comfort Models for Non-Uniform and Transient Environments, Part IV: Adaptive Neutral Setpoints and Smoothed Whole-Body Sensation Model,” Building and Environment, Vol.72, pp.300-308, 2014.
[https://doi.org/10.1016/j.buildenv.2013.11.004]

-
S. I. Tanabe, K. Kobayashi, J. Nakano, Y. Ozeki and M. Konishi, “Evaluation of Thermal Comfort Using Combined Multi-Node Thermoregulation (65MN) and Radiation Models and Computational Fluid Dynamics (CFD),” Energy and Buildings, Vol.34, No.6, pp.637-646, 2002.
[https://doi.org/10.1016/S0378-7788(02)00014-2]

-
A. Aryal and B. Becerik-Gerber, “Energy Consequences of Comfort-Driven Temperature Setpoints in Office Buildings,” Energy and Buildings, Vol.177, pp.33-46, 2018.
[https://doi.org/10.1016/j.enbuild.2018.08.013]

-
M. K. Shourav, S. Salsabila, J. -Y. Lee and J. K. Kim, “Estimation of Core Body Temperature by Near-Infrared Imaging of Vein Diameter Change in the Dorsal Hand,” Biomedical Optics Express, Vol.12, No.8, pp.4700-4712, 2021.
[https://doi.org/10.1364/BOE.431534]

-
A. Aryal and B. Becerik-Gerber, “Thermal Comfort Modeling When Personalized Comfort Systems Are in Use: Comparison of Sensing and Learning Methods,” Building and Environment, Vol.185, pp.107316, 2020.
[https://doi.org/10.1016/j.buildenv.2020.107316]

-
D. Wang, H. Zhang, E. Arens and C. Huizenga, “Observations of Upper-Extremity Skin Temperature and Corresponding Overall-Body Thermal Sensations and Comfort,” Building and Environment, Vol.42, No.12, pp.3933-3943, 2007.
[https://doi.org/10.1016/j.buildenv.2006.06.035]

-
W. Liu, Z. Lian and Q. Deng, “Use of Mean Skin Temperature in Evaluation of Individual Thermal Comfort for a Person in a Sleeping Posture Under Steady Thermal Environment,” Indoor and Built Environment, Vol.24, No.4, pp.489-499, 2014.
[https://doi.org/10.1177/1420326X14527975]

-
S. Y. Sim, M. J. Koh, K. M. Joo, S. W. Noh, S. Park, Y. H. Kim and K. S. Park, “Estimation of Thermal Sensation Based on Wrist Skin Temperatures,” Sensors, Vol.16, No.4, 2016.
[https://doi.org/10.3390/s16040420]

-
T. Chaudhuri, Y. C. Soh, H. Li and L. Xie, “Machine Learning Driven Personal Comfort Prediction by Wearable Sensing of Pulse Rate and Skin Temperature,” Building and Environment, Vol.170, Paper No.106615, 2020.
[https://doi.org/10.1016/j.buildenv.2019.106615]

-
S. Liu, S. Schiavon, H. P. Das, M. Jin and C. J. Spanos, “Personal Thermal Comfort Models with Wearable Sensors,” Building and Environment, Vol.162, Paper No.106281, 2019.
[https://doi.org/10.1016/j.buildenv.2019.106281]

-
T. Goto, J. Toftum, R. de Dear and P. O. Fanger, “Thermal Sensation and Thermophysiological Responses to Metabolic Step-Changes,” International Journal of Biometeorology, Vol.50, No.5, pp.323-332, 2006.
[https://doi.org/10.1007/s00484-005-0016-5]

-
B. Pavlin, G. Pernigotto, F. Cappelletti, P. Bison, R. Vidoni and A. Gasparella, “Real-Time Monitoring of Occupants’ Thermal Comfort through Infrared Imaging: A Preliminary Study,” Buildings, Vol.7, No.1, Paper No.10, 2017.
[https://doi.org/10.3390/buildings7010010]

-
A. Ghahramani, G. Castro, B. Becerik-Gerber and X. Yu, “Infrared Thermography of Human Face for Monitoring Thermoregulation Performance and Estimating Personal Thermal Comfort,” Building and Environment, Vol.109, pp.1-11, 2016.
[https://doi.org/10.1016/j.buildenv.2016.09.005]

-
Y. Lee and J. K. Kim, “Thermal-Sensation Estimation Based on Skin Temperature Measured by a Thermographic Camera,” Transactions of KSME, Vol.43, No.6, pp.399-406, 2019.
[https://doi.org/10.3795/KSME-B.2019.43.6.399]

-
Y. Lee, H. Lee, B. H. Kang and J. K. Kim, “Machine Learning-based Personal Thermal Comfort Model for Electric Vehicles with Local Infrared Radiant Warmers,” Journal of Mechanical Science and Technology, Vol.35, No.7, pp.3239-3247, 2021.
[https://doi.org/10.1007/s12206-021-0644-7]

-
Y. Lee, H. Lee and J. K. Kim, “Simulation of Human Thermal Comfort Considering Local Radiant Heating for Passengers in Electric Vehicles,” Transactions of KSAE, Vol.27, No.12, pp.933-940, 2019.
[https://doi.org/10.7467/KSAE.2019.27.12.933]

-
B. Prasad, Y. Lee, B. H. Kang, J. K. Kim and H. J. Lee, “Development of a Thermal Physiological Model to Analyze the Effect of Local Radiant Heaters in Electric Vehicles,” Journal of Mechanical Science and Technology, Vol.33, No.7, pp.3577-3584, 2019.
[https://doi.org/10.1007/s12206-019-0652-z]

-
M. H. Fakir and J. K. Kim, “Prediction of Individual Thermal Sensation from Exhaled Breath Temperature Using a Smart Face Mask,” Building and Environment, Vol.207, Paper No.108507, 2022.
[https://doi.org/10.1016/j.buildenv.2021.108507]

-
M. H. Fakir, S. E. Yoon, A. Mohizin and J. K. Kim, “Prediction of Individual Dynamic Thermal Sensation in Subway Commute Using Smart Face Mask,” Biosensors, Vol.12, No.12, Paper No.1093, 2022.
[https://doi.org/10.3390/bios12121093]

-
J. Y. Kwon, J. K. Kim, H. Lee, D. Lee and D. Y. Ju, “A Comprehensive Overview of Basic Research on Human Thermal Management in Future Mobility: Considerations, Challenges, and Methods,” Sustainability, Vol.15, No.9, p.7335, 2023.
[https://doi.org/10.3390/su15097335]

