AI Analysis Using the Collision Test Data of the Urban Railroad Vehicle’s Rubber Shock Absorber
Copyright Ⓒ 2022 KSAE / 196-02
This is an Open-Access article distributed under the terms of the Creative Commons Attribution Non-Commercial License(http://creativecommons.org/licenses/by-nc/3.0) which permits unrestricted non-commercial use, distribution, and reproduction in any medium provided the original work is properly cited.
Abstract
Railway vehicles are characterized by a device that connects the locomotive and the carriages. Thus, it is necessary to withstand the possible impact of this connector, and protect the passengers. To absorb the impact energy, a damping system was applied to the railroad car connector. Actual experiments are most important in confirming the performance of the connector. However, since it is costly and risky, we simulated it. In this study, the degree of impact is calculated by inputting the impact test data of the shock absorber by using artificial intelligence. Based on the results of the collision test of the connector for railroad vehicles that was performed at the crash test site, we will proceed with the modeling for each unit, and develop an artificial intelligence model for predicting the degree of impact through artificial intelligence. The data that must be dealt with in this study include the rubber buffer(EGF3). They are extracted from the previous crash test, and include information on the weight of the vehicle, the speed of the collision, and the displacement of the shock absorber that occurs during a collision. Based on the analysis, it was confirmed that the target for the validation data and the prediction related to it showed similar tendencies. This is an initial study in which artificial intelligence is applied to the rubber shock absorber model of railroad cars.
Keywords:
Artificial intelligence, Collision, Modeling, Railroad vehicle, Rubber absorber1. Introduction
Due to the spread of COVID-19, the Korean government is carrying out projects related to the Green New Deal in earnest. For this reason, one of the representative eco-friendly energy businesses, the transportation of railroad vehicles, is attracting attention. Railway vehicles can be said to be a representative means of transportation that does not emit carbon.
The main characteristic of these railroad vehicles is that there is a connector connecting the locomotive and the carriage. In the case of a connector for railroad vehicles, it must withstand possible shocks when connecting between vehicles. In addition, passengers must be protected from collisions that occur in unforeseen circumstances. For that reason, a buffer system is used to absorb the energy generated by the collision.
It is a rubber buffer that is used as a shock absorber for a general railroad car connector system. In previous studies, dynamic simulations using the characteristic curves of rubber shock absorbers were conducted. In previous studies, a program to predict collisions was developed by constructing a simple dynamic model. For this study, the method of inputting the impulse data in the LOOK-UP TABLE format was adopted.1) This method should correct the shock test data value of the shock absorber. Therefore, an analysis error may occur in the section where oscillation occurs after the shock of the shock absorber.2) To prevent such errors, the impact amount is calculated by inputting the impact test data of the shock absorber using an artificial intelligence technique. In this study, we intend to develop a simulation that tracks the experimental results of rubber shock absorbers using artificial intelligence techniques.
2. Rail Vehicle Shock Absorber Components
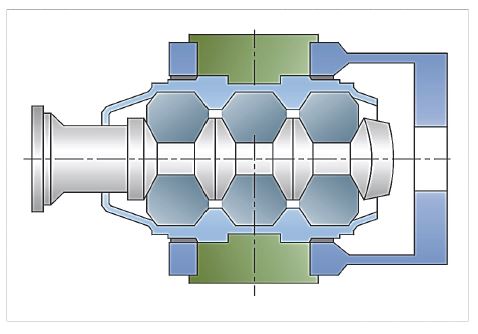
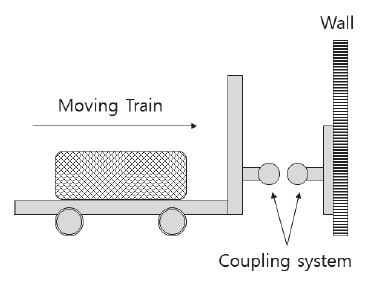
The railway vehicle to be carried out in this study is an urban railway vehicle. Before introducing the crash, test used in the simulation, we would like to introduce the components of the rubber shock absorber. The most recently used rubber buffer is EGF3, which was tested in this study.3) In the case of EGF3 buffers, it can be completely sealed. Therefore, it is very easy to attach and detach, and it has the advantages of simple maintenance and low vibration and noise. The rubber shock absorber has a shape as shown in Fig. 1. In the case of this connector, the internal annular rubber shock absorber plays a role in absorbing impact energy. Fig. 2 is a Diagram of measurement of collision test. Rubber buffer is activated when a certain amount of force is applied to the shock absorbers.4)
3. Construction of a Crash Test for Railroad Vehicles
In this study, individual tests were conducted. The experiment was conducted at the Crash Test Center of the Korea Railroad Research Institute. It is impossible to conduct a crash test with trains organized. Therefore, it was applied to the simulation developed in this study based on the results of the collision test for each unit. Fig. 2 shows the shape of the collision experiment.5) According to the characteristics of each unit, the collision speed, vehicle weight, and number of experiments were set differently. Since there is a difference in the capacity of each unit, the following experiments were conducted to minimize damage to the parts.
The weight of the wagon during the collision was 20 tons. The variable connector assembly was mounted on the collision vehicle and the dummy connector assembly was firmly assembled and mounted on the fixed wall. It was corrected through the operation of the test vehicle whether the variable connector assembly mounted on the collision vehicle and the dummy connector assembly mounted on the fixed wall could be matched and combined.
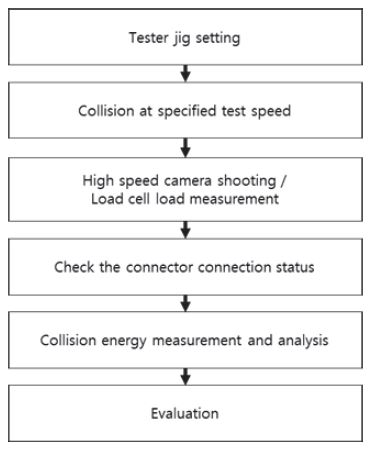
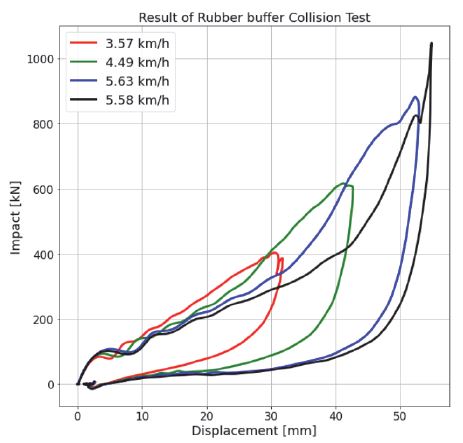
The collision speed was increased to 3.57 km/h, 4.49 km/h and 5.63 km/h in the tolerance state. In the case of a speaker, there is no speed regulation regarding vehicle collisions, unlike a carriage. For this reason, tests were conducted at 5.58 km/h or less according to the judgment obtained empirically. The collision vehicle mounted with the variable connector assembly collides against the fixed wall at the test speed. During the test, the lower part of the test body is photographed using a high-speed camera to check the behavior of the connector and the buffer. Visually check the coupling and damage of the variable connector and dummy connector. After the collision, the load caused by the collision of the test body and the fixed wall is measured, and the measured items are synchronized to derive the force-displacement diagram and absorption energy hypocrisy. After one collision, release the combined state of the variable connector and dummy connector, and then accelerate the test. Fig. 3 is a flowchart of the experimental method.
Analyze the crash test results. At a crash test speed of 3.57 km/h, the shock absorber capacity of the connector is up to 401 kN. In a subsequent impact at 4.49 km/h, the rubber connector cushioning force is up to 620 kN. At 5.63 km/h, the maximum shock-absorbing force is about 880 kN, and at the last collision, 5.58 km/h, the maximum shock-absorbing force is 1,150 kN. The maximum stroke of the rubber connector used in this study was 550 mm. No breakage of the connector was found during the crash test.
4. AI Model Development and Analysis Results for Predicting the Impact of Railway Vehicles
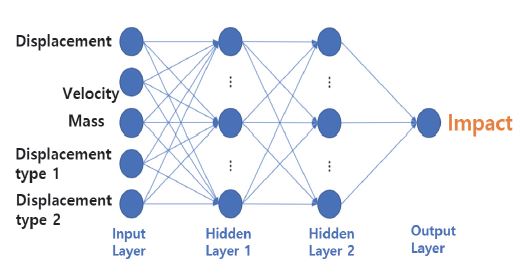
The data to be dealt with in this study is the rubber buffer (EGF3).6) This data is data extracted from the previous crash test and has information on the weight of the vehicle, the speed of the collision, and the displacement of the shock absorber that occurs during a collision. Since the data has a hysterical characteristic,7) it is necessary to include the displacement state information in the model predicting the amount of impact. Therefore, the input elements of the model consist of a total of four factors: vehicle collision speed, vehicle weight, displacement, and displacement state. The target of the model to be developed is the amount of impact.
Since displacement is a classification variable, data was processed using one-hot encoding. The learning data to be used for learning and the validation data to be used for the validation of the learning model were separated in a ratio of 90:10. To reduce the deviation of the input value, data normalization was performed based on the training data. The Normalization technique used at this time is standard normalization. The artificial neural network was constructed as shown in Table 1 and Fig. 5.8,9)
As described above, for the training and the evaluation of generalization performance for the artificial neural network, the training dataset and the validation dataset were divided in a ratio of 9:1. The total number of data samples is about 32,000, and the training data consists of about 28,800 samples and the validation data is about 3,200 samples. We processed features through normalization as in Eq. (1) in order to prevent instability of learning due to deviation of values between features. In Eq. (1), means the standard deviation and average for each feature in the training data.10)
| (1) |
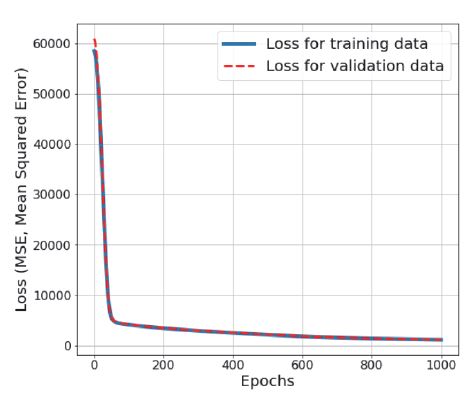
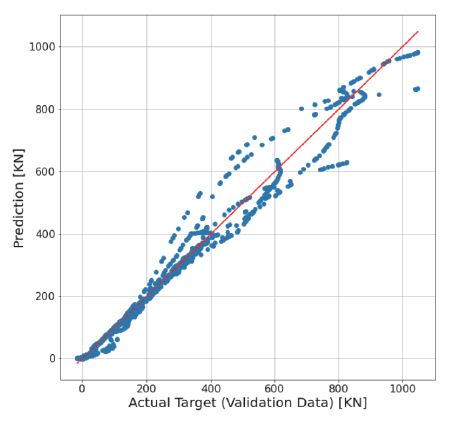
The learning curve is shown in Fig. 6. Over-fitting did not occur. That is, it can be seen that the loss on the verification data decreased stably as the number of learning increases. Table 2 shows the average values of the errors of the training data11) and the val id data. The average value shows a high value during initial learning, but it can be seen that the loss data value decreased as learning continues. Fig. 7 is the Target for Validation Data and the Prediction for it show a similar tendency. There is a part in the middle where the deviation between the predicted value and the actual value is relatively large. Because of model analysis, it was found that the AI model simulates the impact characteristics well. The model analysis result is shown in Fig. 8.
5. Conclusion
In this study, a rubber buffer shock simulation of a railroad car was simulated using an artificial intelligence neural network technique. Machine learning was performed based on the existing railway vehicle impact test data. When a vehicle crashes, it is simulated using data according to the displacement and impact amount of the rubber buffer, and the weight and speed of the vehicle. As a result, it was confirmed that the target for validation data and the prediction for it show similar tendencies. In addition, it was interpreted that the developed artificial intelligence model mimics the impact characteristics well. This study is an initial study in which artificial intelligence is applied to the rubber shock absorber model of railroad cars.
Acknowledgments
This work is supported by the Korea Railroad Research Institute(KRRI) grant, Core Technologies Development for Enhancing operational Efficiency of Railway Network (PK2102D1).
References
-
S. Lim, Y. Ji and Y. Park, “Simulation of Energy Absorption Performance of the Couplers in Urban Railway Vehicles during a Heavy Collision,” Machines, Vol.9, No.5, 2021.
[https://doi.org/10.3390/machines9050091]

-
C. Song, S. Lee, B. Gu, I. Chang, G. Cho, J. Baek and S. Cha, “A Study of Anode-Supported Solid Oxide Fuel Cell Modeling and Optimization Using Neural Network and Multi-Armed Bandit Algorithm,” Energies, Vol.13, No.7, p.1621, 2020.
[https://doi.org/10.3390/en13071621]

-
Y. Ji, S. Lim and Y. Park, “Collision Test Simulation of the Urban Railway Vehicle Connector Absober,” Transactions of KSAE, Vol.29, No.8, pp.733-740, 2021.
[https://doi.org/10.7467/KSAE.2021.29.8.733]

- Y. I. Park, “Simulation Technology on The Cushion Characteristics of Rolling Stock Coupler,” Auto Journal, KSAE, Vol.33, No.11, pp.26-31, 2011.
-
N. Kim and Y. Park, “Collision Tests and Model Development of a Train Coupling System Using a High-capacity Energy Absorber,” Journal of Rail and Rapid Transit, Vol.232, No.9. pp.2215-2227, 2018.
[https://doi.org/10.1177/0954409718766930]

-
G. J. Gao and H. Q. Tian, “Train’s Crashworthiness Design and Collision Analysis,” International Journal of Crashworthiness, Vol.12, No.1, pp.21-28, 2010.
[https://doi.org/10.1533/ijcr.2006.0138]

-
H. Maeng, J. Kim and Y. Park, “Collision Simulation for the Coupler System of Rolling Stock,” Journal of the Korean Society of Manufacturing Technology Engineers, Vol.22, No.3-1, pp.566-572, 2013.
[https://doi.org/10.7735/ksmte.2013.22.3.566]

-
C. Song, H. Lee, C. Kang, W. Lee, Y. B. Kim and S. Cha, “Traffic Speed Prediction Under Weekday Using Convolutional Neural Networks Concepts,” IEEE Intelligent Vehicles Symposium, 2017.
[https://doi.org/10.1109/IVS.2017.7995890]

-
N. Kim and Y. Park, “Performance Tests of a High Capacity Buffer Coupling System using a Hydraulic Device,” Journal of the Korean Society of Safety, Vol.31, No.1, pp.33-40, 2016.
[https://doi.org/10.14346/JKOSOS.2016.31.1.033]

- C. Cracium, A. Mitu, C. Cruceanu and T. Sireteanu, “Modeling the Buffers Hysteretic Behavior for Evaluation of Longitudinal Dynamic In-train Forces,” SISOM 2012 and Session of the Commission of Acoustics, 2012.
-
A. Freidenberg, C. W. Lee, B. Durant, V. F. Nesterenkob, L. K. Stewart and G. A. Hegemier, “Characterization of the Blast Simulator Elastomer Material Using a Pseudo-elastic Rubber Model,” International Journal of Impact Engineering. Vol.60, pp.58-66, 2013.
[https://doi.org/10.1016/j.ijimpeng.2013.04.009]


