A Study on the Status of Automobile Parts Distribution for the Revitalization of Alternative Parts Market in Korea
Copyright Ⓒ 2022 KSAE / 195-10
This is an Open-Access article distributed under the terms of the Creative Commons Attribution Non-Commercial License(http://creativecommons.org/licenses/by-nc/3.0) which permits unrestricted non-commercial use, distribution, and reproduction in any medium provided the original work is properly cited.
Abstract
Although the proportion of imports and exports in the domestic finished car market is high globally, the size of the auto parts market is significantly smaller than that of the finished car market, suggesting that the domestic auto parts market can grow further. Despite the introduction of the alternative parts certification system, the production of alternative parts is fundamentally blocked by the domestic design protection law and the dependence on automakers only increases, as the profitability of parts makers gradually deteriorate. In this study, we are proposing a plan to improve domestic alternative parts distribution by analyzing the current status of the automobile repair and parts market, and the operation of alternative parts to revitalize domestic alternative parts.
Keywords:
Alternative parts, Exclusive transaction, Dependent structure, Original equipment manufacturing, Block exemption regulation1. Introduction
In the automobile industry, the parts market occupies an important place in the aftermarket following the finished car market. However, in the case of the domestic auto parts market, small and medium-sized manufacturers have difficulty finding a market because automakers and manufacturers have already formed an exclusive transaction relationship. Manufacturers also have to take on the burden of cost reduction and quality improvement to reflect consumer needs.
Unlike the vertical operation integration1) and integrated structure of the domestic parts market, the overseas parts market has a horizontal market structure and is legally and institutionally complete with a free competition system between companies. It has moved away from the monopoly market structure of finished vehicles2) and the market size for non-OEM and used parts is also growing. These developments are providing consumers with price reduction opportunities by utilizing various distribution channels.
The fundamental reasons for the long-standing practice and distribution structure of the domestic parts market that do not deviate from the form of exclusive transactions but depend on OEMs are the lack of technology, lack of capital from new product development to sales, and stable disconnection of customers. Despite the introduction of the alternative parts certification system, the production of alternative parts is fundamentally blocked by the domestic design protection law.3)
This study aims to present a new paradigm to the automobile industry by the following actions: expanding the base of the domestic automobile replacement parts market; presenting a plan to improve the distribution of domestic automobile alternative parts;4) and by analyzing the current state of the domestic automobile repair parts market and the operation of alternative parts.
2. Analysis of Global Parts Market Size by Country
The global parts market size by country was tabulated by referring to the data of the Ministry of Trade, Industry and Energy.5)
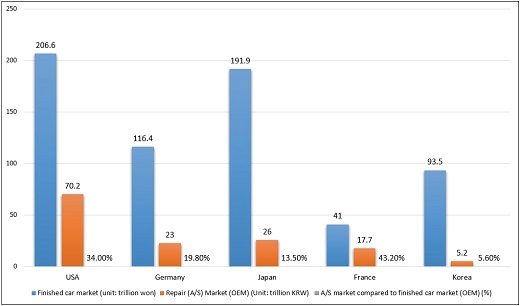
Fig. 1 shows the size of the finished car market and A/S market by country as of 2019. The size of the finished car market is in this descending order: the US, Japan, Germany, Korea, and France, while the A/S market size ranks Korea the lowest at 5.6 % in contrast to the finished car market.
This suggests that there is room to further develop the domestic A/S and parts market size by revitalizing the sector.
3. Analysis of Domestic Auto Parts Market Trends
The domestic auto parts industry’s primary subcontractors size and yearly domestic parts industry sales performance were analyzed and tabulated based on the Korea Auto Industries Cooperative Association(KAICA)6) data.
3.1 Analysis of the Status of Primary Subcontractors in the Domestic Auto Parts Industry by Company Size
In terms of the number of parts companies as of 2020, there are a total of 744 companies, with 478 small and medium-sized enterprises(SMEs) having average sales of less than KRW 100 billion in three years, accounting for 64.2 % of the total. There are 266 companies with total assets of KRW 500 billion or more and 30 % or more of corporate stock, while large corporations belonging to a group with limited mutual investment or a group of limited debt guarantee accounted for 35.8 % of the total. The number of companies decreased by 2.4 % compared to the previous year due to the closure of GM Korea’s Gunsan plant in 2018, and is down by 9.7 % compared to the previous year due to the closure of the Daewoo Bus Ulsan plant in June 2020.
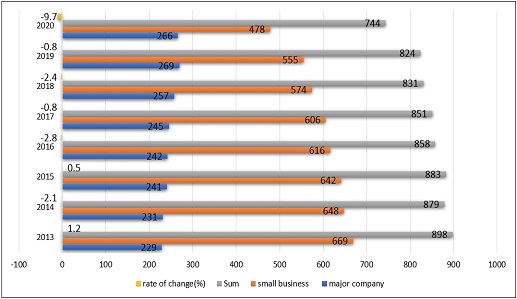
Analysis of the rate of change in the number of primary subcontractors in the domestic auto parts industry
The domestic auto parts market is operated as a vertically integrated business structure consisting of a number of subcontractors supplying parts and automobile manufacturers including Hyundai, Kia, GM Korea, Renault Samsung, Ssangyong, and Tata Daewoo.
3.2 Analysis of Sales Results of the Domestic Parts Industry by Year
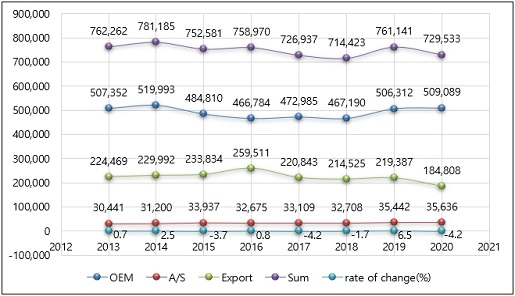
Fig. 3 shows the sales performance of the domestic auto parts industry by year. From 2013 to 2020, there is relatively no significant change in sales performance. In 2020, due to the impact of COVID-19 and a decrease in export performance, sales were recorded at KRW 72,953.3 billion, down 4.2 % from the previous year. OEMs account for 69.8 % with KRW 50,908.9 billion, exports 25.3 % with KRW 18.48 trillion, and A/S 4.9 % with KRW 3.56 trillion.
The domestic auto parts market is in the same context as the finished car sales sector, so it has a significant problem due to the high dependence on finished car makers.
4. Statistical Analysis of the Number of Exchange Cases and Share by Task
The number of exchanges and their share by work content were tabulated by analyzing the data7) of the Korea Transportation Safety Authority(KOSTA) Information Office. An aggregated statistics for 2017-2019 were obtained by classifying 62 types of parts by domestic work content into engine, chassis, body, interior, and high-power electrical equipment. The number of exchanges and share was also classified by part type by imported parts, new products, remanufactured products, and used products. Thus, the distribution type of the domestic parts market and the trend by part type were subsequently analyzed.
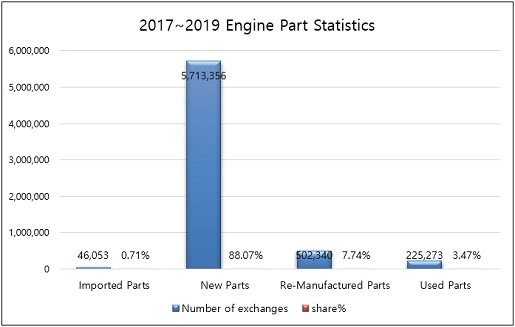
Fig. 4 shows the number and share of engine parts replacements. New products represent 5,713,356 cases (88.07 %), remanufactured products represent 502,340 cases (7.74 %), used parts represent 225.273 cases (3.47 %), and imported parts account for 46,053 cases (0.71 %).
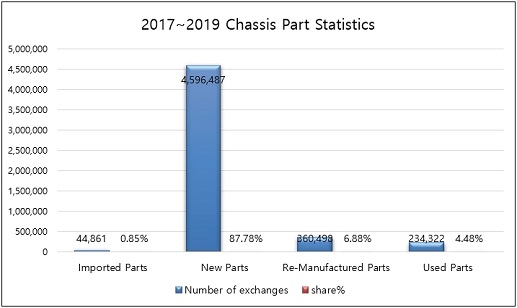
In Fig. 5, new chassis parts account for 4,596,487 cases (87.78 %), remanufactured parts 360,499 cases (6.88 %) used parts 234,322 cases (4.48 %), and imported parts 44,861 cases (0.85 %).
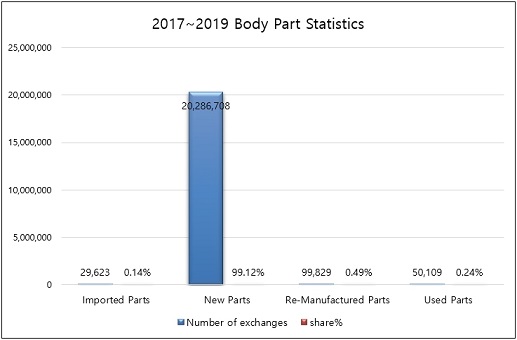
In Fig. 6, for body parts, new parts represent 20,286,708 cases (99.12 %), remanufactured 99,829 cases (0.49 %), used parts 50,109 cases (0.24 %), and imported parts 29,626 cases (0.14 %).
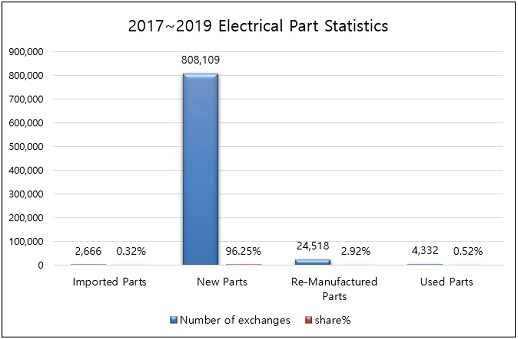
In Fig. 7, for interior parts, new parts represent 808,109 cases (96.25 %), remanufactured 24,518 cases (2.92 %), used parts 4,332 cases (0.52 %), and imported parts 2,666 cases (0.32 %).
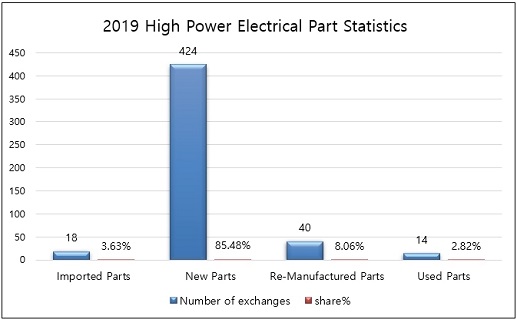
In Fig. 8, statistics on high-power electric devices used in electric vehicles, etc. started in 2019, so the statistics for 2019 were analyzed. New parts represent 424 cases (85.48 %), manufactured parts 40 cases (8.06 %), imported parts 18 cases (3.63 %), and used parts 14 cases (2.82 %). The high-power electric device parts market is expected to gradually expand as the automobile business structure is centered on eco-friendly vehicles and the demand gradually increases.
Based on the statistics presented in Figs. 4 to 8, it is confirmed that most of the distribution of auto parts is biased towards new parts sales.
5. Analysis of Trends in Parts and Wage by Year and Vehicle Type
Parts and wage data for each vehicle type and year were tabulated by acquiring and analyzing data from the KARIF Smartway system.8)
5.1 Analysis of Parts Cost Trends by Vehicle Type and Year
The total amount, total number, and average parts cost were calculated by year for engine, chassis, body, and interior parts for each vehicle type - passenger, van, cargo, and special vehicles -. By calculating the average parts cost for each year, the trends in the total parts cost and the average parts cost were analyzed.
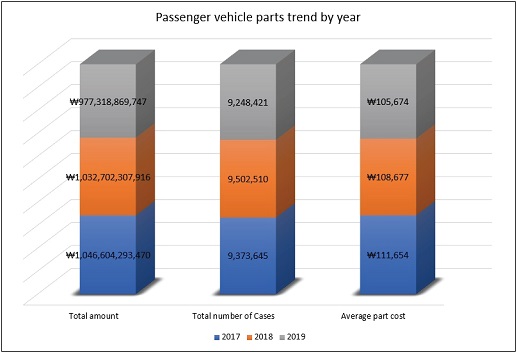
Fig. 9 shows the total cost amount of parts and average parts cost by year for passenger vehicles. The total cost amount of parts decreased from KRW 1,046,604,293,470 in 2017 to KRW 1,032,702,307,916 in 2018, and decreased to KRW 997,318,869,747 in 2019. The total number of cases increased from 9,373,645 cases in 2017 to 9,502,510 cases in 2018, and then decreased to 9,248,421 cases in 2019. The average cost of parts also decreased from KRW 111,654 in 2017 to KRW 108,677 in 2018 and KRW 105,674 in 2019.
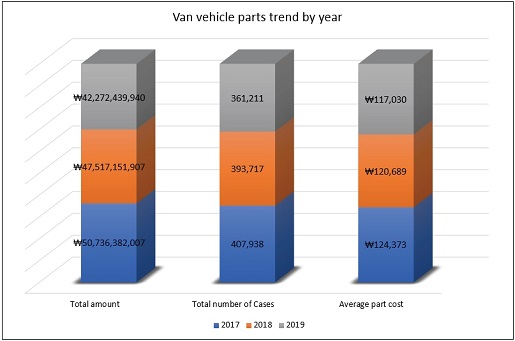
As shown in Fig. 10, the total cost amount of parts for vans decreased from KRW 50,736,382,007 in 2017 to KRW 47,517,151,907 in 2018 and KRW 42,272,439,940 in 2019. The total number of cases gradually decreased to 407,938 in 2017, 393,717 in 2018, and 361,211 in 2019. The average parts cost also decreased from KRW 124,373 in 2017 to KRW 120,689 in 2018 and KRW 117,030 in 2019.
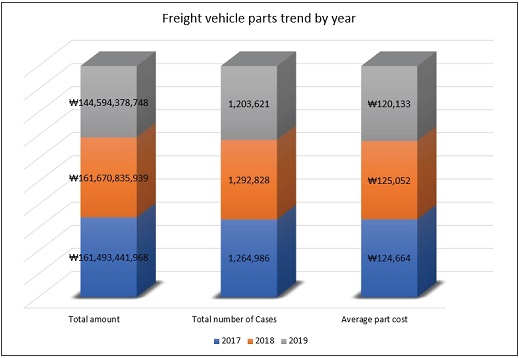
As shown in Fig. 11, the total cost amount of parts for freight vehicles increased from KRW 161,493,441,968 in 2017 to KRW 161,670,835,939 in 2018, and decreased to KRW 144,594,378,748 in 2019. The total number of cases increased from 1,264,986 in 2017 to 1,292,828 in 2018, and decreased to 1,203,621 in 2019. The average parts cost increased from KRW 124,664 in 2017 to 125,052 in 2018, and decreased to KRW 120,133 in 2019.
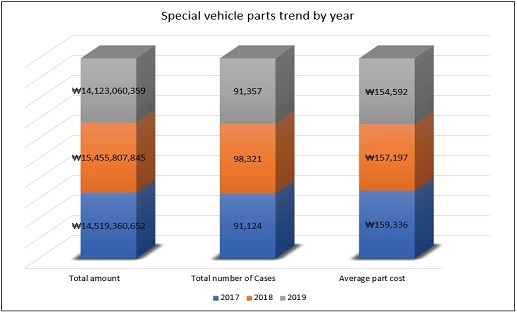
As shown in Fig. 12, the total cost amount of special vehicle parts rose from KRW 14,519,360,652 in 2017 to KRW 15,455,807,845 in 2018, and decreased to KRW 14,123,060,359 in 2019. The total number of cases increased from 91,124 cases in 2017 to 98,321 cases, and decreased to 91,357 cases in 2019. The average parts cost decreased from KRW 159,336 in 2017 to KRW 159,197 in 2018 and KRW 154,592 in 2019.
5.2 Analysis of Wage Cost Trends by Vehicle Type and Year
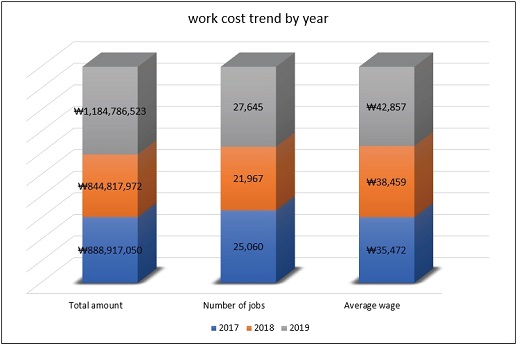
Fig. 13 shows the total wage cost / total number of jobs = average wage cost by year from 2017 to 2019. The total wage cost amount for work increased from KRW 888,917,050 in 2017 to KRW 844,817,972 in 2018 and KRW 1,184,786,523 in 2019. The number of job cases increased from 25,060 in 2017 to 21,967 in 2018 and 27,645 in 2019. Thus, the average work wage cost gradually increased from KRW 35,472 in 2017 to KRW 38,459 in 2018 and KRW 42,857 in 2019.
6. Survey and Statistical Analysis for the Activation of the Alternative Auto Parts Sector
From September 18, 2020 to December 17, 2020, the factors hindering the development of the domestic alternative auto parts industry, as well as solutions were surveyed and analyzed based on forums and e-mails. A total of 120 companies engaged in parts manufacturing and alternative auto parts manufacturing industries were targeted.
This chapter analyzes the primary factors impeding the development of the alternative parts market and the suggested solutions to clearly define the needs of the industry and consumers. The development of the alternative auto parts industry is expected to play a role not only in the growth of the auto parts industry but also in activating the current sluggish automobile maintenance market.
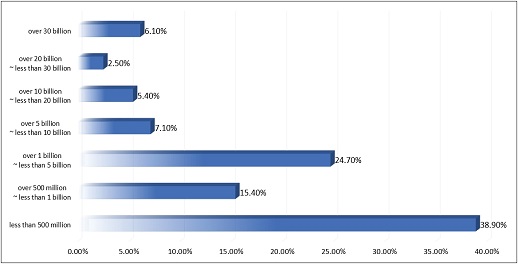
Fig. 14 presents the annual sales of alternative parts manufacturers. Companies with under KRW 500 million represent the most at 38.9 %, followed by those with KRW 1 billion to under KRW 5 billion (24.7 %), those with KRW 500 million to under 1 billion (15.4 %), those with KRW 5 billion to under 10 billion (7.1 %), those with KRW 30 billion or more (6.1 %), and those with KRW 20 billion to under 30 billion (2.5 %).
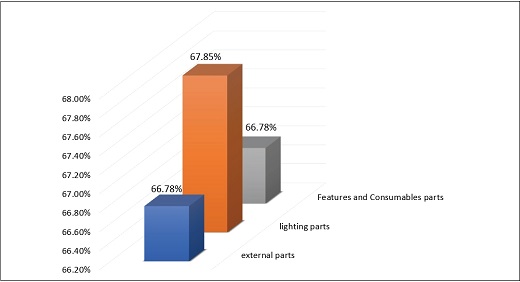
As shown in Fig. 15, the survey presents the desired price compared to the OEM parts price by alternative parts. Exterior parts were expected to be priced at 66.78 % of the OEM parts price, lamp parts at 67.85 %, and functional and consumable parts at 66.78 %.
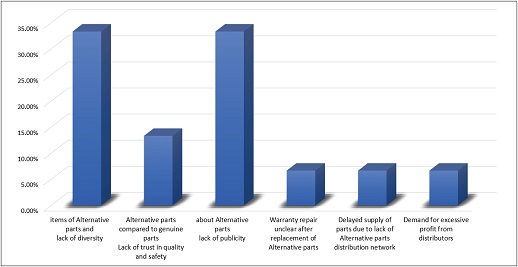
As shown in Fig. 16, a survey was conducted on why the alternative parts market was deactivated. The first priority was found to be a lack of items and diversity of alternative parts and a lack of publicity for alternative parts, accounting for 33 % each factor.
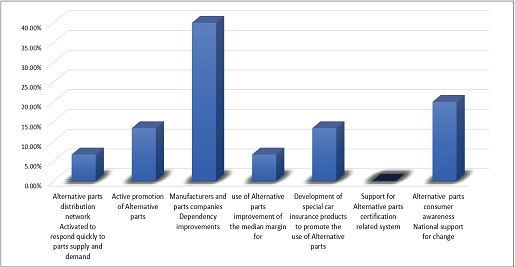
As shown in Fig. 17, a survey was conducted on points for improvement to revitalize the alternative parts market. A need to improve the subordinate structure relationship between manufacturers and parts makers was highest at 40 %, followed by national support activities to change consumer perception of alternative parts, etc.
7. Proposed Distribution Structure to Activate Alternative Parts
7.1 A Comparative Analysis of Domestic and Foreign Alternative Parts Certification Systems
As shown in Table 1, the US auto parts industry is highly structured that automakers and their parts-making subcontractors assume an equal position. Auto insurance companies have created an environment where the leading alternative parts can be used, promoting alternative parts through insurance companies. Also, there is an opinion that the manufacturers’ design patents are registered for the exclusive production of their repair parts, not for the purpose of protecting the design of their vehicles. Thus, along with the argument that insurance companies should limit the design protection of repair parts, relevant legislation continues to be proposed.
The first purpose of the European BER system was to protect the automobile industry, but at the time of the system’s introduction, a monopoly similar to that of Korea was formed. Recognizing that this monopoly was wrong, they succeeded in strengthening the independence of subcontractors by improving the monopoly structure through the third revision of the BER.
Japan’s auto parts industry has a mountain range structure, a stable industrial structure in which transactions between various automakers and subcontractors are stable. There is also a free competition system between parts makers rather than an OEM monopoly, thereby facilitating the price reduction effect on consumers by using various distribution channels. They are also revitalizing the alternative parts market by introducing a high-quality parts system that designates a producer and evaluates all parts produced by the designated manufacturer as excellent parts.
7.2 Suggested Distribution Structure for the Revitalization of Domestic Alternative Parts
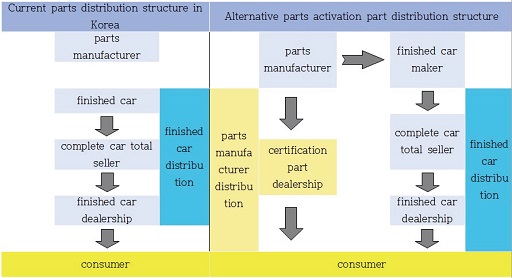
Fig. 18 shows the existing domestic parts distribution structure and proposals for the distribution channels to promote alternative parts. The existing domestic parts distribution structure is highly dependent on automakers due to exclusive transactions and subordinate structures. This causes the profitability of small and medium enterprises to gradually deteriorate and prevents the development of small and medium-sized parts manufacturers. Furthermore, the burden of having to reduce costs and improve quality due to excessive competition is being passed on to parts manufacturers.
It is expected that the alternative parts market will be further activated, if this structure is transformed into a horizontal distribution structure between parts manufacturers and finished car manufacturers. The parts manufacturers provide certified products to consumers through their own distribution network, while the finished car manufacturers make parts received from the parts makers available to consumers through the existing finished car distribution channels.
In addition, measures should be prepared that can provide benefits to manufacturers, sellers, and consumers when they use alternative parts by justifying the businesses’ pursuit of profit and acknowledging the various rights of consumers.
8. Conclusion
- 1) The domestic finished car market currently occupies a high proportion of the global market. However, compared to the domestic finished car market, the domestic A/S market has a small market structure. This has a direct impact on the parts market, but has potential influence for further growth of the parts market. However, the fact that the domestic parts industry sales remained unchanged from 2013 to 2020 indicates that what is required for the revitalization of the parts markets should be systematically supplemented.
- 2) The statistics on the number of replacement parts and parts share for each work in Korea indicate that new parts account for at least 85 % of the total parts volume, ranging from engines, chassis, body, and equipment to high-power electronic devices. This suggests that the new parts market is alienating the various parts markets such as remanufactured products, used parts, and imported parts. If the alternative parts market is activated in the new parts-dominated parts market, a better market structure can be formed for SMEs.
- 3) Based on the analysis of parts and wage trends by year and by vehicle type, the total parts cost and average parts cost from 2017 to 2019 showed an unstable market, while the average wage cost increased steadily. This demonstrates that the parts consumption market is shrinking as the dependence on hired labor (wage) increases instead of an increase in parts consumption. The performance trend of the domestic parts market is linked to the sales status of finished cars, which is seen as a limitation of the parts market. For this reason, it is necessary to come up with a plan to revitalize the alternative parts market.
- 4) A survey on the activation of alternative auto parts was conducted. It pointed out the lack of alternative parts items, variety and lack of promotion of alternative parts as the causes of the deactivation of alternative parts sector. The reality is that the development of alternative parts items is hindered by domestic design rights, and this is a problem that needs to be solved legally and systematically. The lack of publicity for alternative parts also needs to be resolved urgently by conducting various public relations activities, aimed at enhancing consumer awareness and the use of the Internet and applications for such campaigns.
- 5) Unlike the domestic exclusive transaction and subordinate structure, the overseas alternative parts market is forming a mutually horizontal distribution structure between parts makers and automakers. This is made possible largely through the government’s will and initiative, along with the efforts of auto insurance companies. The domestic alternative parts market can break away from the current irrational structure by benchmarking overseas cases and establishing a national legal system along with the efforts of insurance companies to encourage the use of alternative parts. Doing this will lead to the development of better quality alternative parts through the capabilities and research of small and medium-sized enterprises. Consumers will also be encouraged to use safer and more economical parts. Furthermore, this will transform the domestic alternative parts market into a virtuous cycle in which the parts industry can be activated through overseas expansion.
Acknowledgments
This thesis was carried out with the financial support of Joongbu University and in response to the request from MOLIT and KOTSA regarding 『Survey and Research on Automotive Parts Certification System and Market Status』 in 2021.
References
- S. J. Choi, “Is Transactions between Vertically Integrated Affiliates an Act that Should be Banned,” KERI Brief, Vol.13, No.15, pp.1-8, 2013.
- S. J. Seong, “Market Analysis Under the Fair Trade Act to Improve the Monopoly Market Structure,” Economic Law Studies, Vol.12, No.2, pp.319-352, 2013.
-
J. O. Kim and I. C. Kim, “A Study on the Revitalization of Automobile Replacement Parts Market by Amendment of Design Protection Law - Focusing on Foreign Cases,” Culture, Media and Entertainment Law, Vol.11, No.1, pp.31-59, 2017.
[https://doi.org/10.20995/CMEL.11.1.2]

- S. D. Gi. “Improvement Plan for Activation of Automobile Certified Alternative Parts,” KIRI Weekly, Vol.512, pp.1-6, 2021.
- Ministry of Trade, Industry and Energy, Automobile Aviation Department, Automobile Tuning Components Business Development Forum, http://www.motie.go.kr/motie/ne/presse/press2/bbs/bbsView.do?bbs_cd_n=81&bbs_seq_n=78899, , 2020.
- KAICA Korea Automobile Industry Cooperative, the Number of Companies by Company Size, Sales Trend by Year, http://www.kaica.or.kr/bbs/content.php?co_id=company, , http://www.kaica.or.kr/bbs/content.php?co_id=sales, , 2021.
- Korea Transportation Safety Authority, Ministry of Information Data, 2020.
- Korea Automobile Repair & Inspection Federation, KARIF Smartway System Data, 2020.

