Stable and Sustainable Vehicle Integrated Control for Truck Platooning
Copyright Ⓒ 2022 KSAE / 194-09
This is an Open-Access article distributed under the terms of the Creative Commons Attribution Non-Commercial License(http://creativecommons.org/licenses/by-nc/3.0) which permits unrestricted non-commercial use, distribution, and reproduction in any medium provided the original work is properly cited.
Abstract
This paper deals with a leader-follower platoon, and uses multiple trucks. In a situation where trucks are configured with platooning, we are proposing a method to optimize the distance between the leader and the follower by integrating the CACC and the pure, pursuit-based longitudinal/lateral controller and a path system among the control systems. To optimize the distance in the truck platooning system, it uses the V2X communication module. To optimize the inter-vehicle spacing in the truck platooning system, information between trucks in the platooning was exchanged by using the V2X communication module, and inter-vehicle spacing was calculated. One of the platooning architecture steps is to design the platooning maintenance. Then, the performance of the designed integrated controller will be verified through simulation. It shows that platooning is maintained stably even on the road with a sharp radius of curvature. Finally, by using the MORAI simulator, a model, including a sustainable urban section and an outdoor section, is created in a Korean-style, autonomous driving experimental city(K-City) in Korea, while stable and sustainable platooning strategies are verified even in areas with a sharp radius of curvature. To evaluate the performance of the system, a driving test of the truck platooning was conducted. As a result, the proposed strategy on roads with a sharp radius of curvature and roundabout proved that sustainable platooning is possible.
Keywords:
Automated vehicle following, Truck platooning, Autonomous vehicle control, Longitudinal control, Lateral control, Path following1. Introduction
Traffic congestion on roads is one of the most challenging problems to solve because of the constant increase in vehicles. There is a way to build additional roads, but there are constraints due to financial and road capacity limitations. To solve this problem, changing many trucks that drive for a long time to self-driving platooning is an effective solution.1) Previous studies have used the ACC system as a method of maintaining the inter-vehicle distance in platooning.2) A typical ACC system maintains the vehicle speed set by the driver at the desired value.3) The ACC system cannot provide feedback because there is no vehicle-to-vehicle communication. That is, there is a problem in stably maintaining the inter-vehicle distance. To solve this problem, platooning research has recently applied the Co-operative Adaptive Cruise Control(CACC) system.4) The CACC system is a system that combines a communication system to control the vehicle in front and the desired distance and vehicle speed.5) Platooning systems applying the CACC system generally use the V2X communication module.6) However, the CACC system also has weaknesses in platooning. Configure platooning based on Constant Time-Gap Policy according to a particular time.7) Increased inter-vehicle spacing errors and inter-vehicle speed errors will cause the vehicle to move further away from the truck in front, making platooning less stable.8) Due to this complexity, existing platooning studies have been actively studied in the longitudinal section.9,10) In other words, existing studies constitute platooning only on highway sections where the longitudinal situation continues.11-14) To implement platooning on public roads rather than highways, research on lateral control and longitudinal control is essential.15,16) This paper is interested in realizing the optimal inter-vehicle distance during platooning by recognizing the minimum possible queue length in truck platooning. In other words, the research goal is to continuously contribute to the stability of platooning by stably maintaining the inter-vehicle distance even in lateral situations required on public roads. In the existing general road, the longitudinal controller and the lateral controller are separately designed and operated.17) Although it is easy to design a controller in this study of a separate platooning controller, when platooning is performed on a public road, the spatial error increases in the lateral direction, and the error increases. In this paper, to reduce the above spatial error, we propose an integrated control that integrates CACC algorithm-based longitudinal control and Pure-pursuit algorithm-based lateral control using global and local paths. This paper uses the V2X communication module. It is an integrated platooning controller configured based on the position of the preceding truck along the path trajectory, speed, inter-vehicle distance, and local path based on position data. In other words, by exchanging information with the vehicle, it is possible to maintain the optimal inter-vehicle distance even in the lateral direction. Based on the integrated controller proposed in this paper, the vehicle speed and inter-vehicle distance, which are the architecture of EUROPEAN COMMISSION-ENSEMBLE(Enabling SafE Multi-Brand pLatooning for Europe), is suggested by ENSEMBLE using a simulator to simulate the vehicle speed and it was performed using a simulator by optimizing the inter-vehicle distance.18) Finally, it shows that the proposed strategy can effectively increase the stability of platooning even on the road with a sharp radius of curvature. In Section 2 of this paper, we describe how to configure truck dynamics and maintain platooning ranks. Section 3 describes the platooning architecture according to the simulator and truck-communication design. Section 4 deals with the integrated control system of truck platooning that integrate longitudinal, lateral and path information. Section 5 uses the simulator to create various scenario models by integrating the integrated controller and algorithm proposed by the Korean autonomous driving experimental city(K-City), verify the strategy, and analyze the truck platooning implementation performance. The last section 6 is the conclusion.
2. Stable Line Maintenance of Platooning
Chapter 2 proposes a stable and sustainable method for truck platooning. First, Dynamics applied to the truck model is dealt with. We describe the longitudinal and lateral controllers offered based on Dynamics and use them as global path and local path information described in Chapter 3. Next, the essential element of truck platooning technology is to be able to accurately know the location of the vehicle and the site of the trucks in the queue. It uses the sensor module V2X to determine the exact location of trucks. We want to explain the algorithm for maintaining the stable final platooning rank position.
2.1 Configure Truck Dynamics
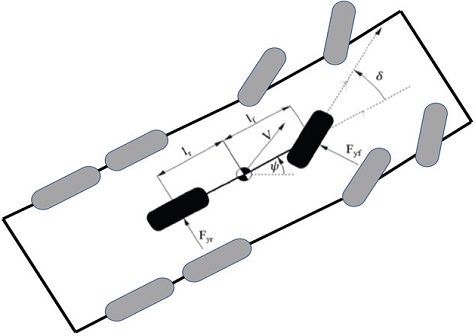
When the truck bi, which is Newton’s second law of motion, only moves linearly in an absolute reference coordinate system i, the change in momentum Li with time is the same as equation 5. Here, the momentum is Li = mi⋅vi. When the same truck bi only rotates in the I-coordinate system, Euler’s Angular momentum theorem is as follows. equations (1) and (2) are applied in Fig. 1 of the system figure, and equations (3) and (4) are the same for truck mass m and yaw mass moment of inertia θ. In other words, if we rearrange the lateral dynamic equation. Therefore, the two degrees of freedom of movement of the four-wheel steering system using the above motion equation, i.e., the sliding angle β and the yaw angular velocity of the vehicle body, were summarized in equation (3).
| (1) |
| (2) |
| (3) |
| (4) |
| (5) |
| (6) |
2.2 Platooning Configuration
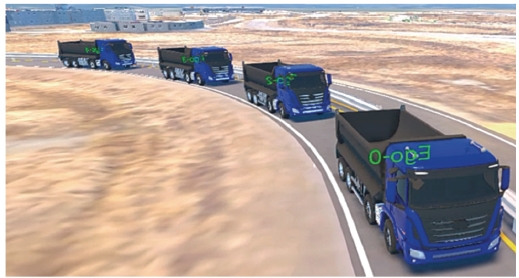
In Fig. 2, the trucks are composed of 4 trucks, and in this chapter, we will strategically describe the truck platooning formation. The car located at the top is indicated as Ti. The truck Ti-1 is the truck that follows Ti. Di denotes the relative distance between Ti and Ti-1 trucks. Based on the platooning algorithm, the required relative distance is Di1ref, expressed by equation (7). Li represents the length of the car. Here, R0 is the speed necessary for the inter-vehicle distance to converge to zero, Hi is the constant time headway and Vi is the current speed of the trucks.
| (7) |
Also, the actual distance between the preceding trucks Di1 is expressed as equation (8).
| (8) |
The spacing error between trucks configured with platooning is expressed as equation (9).
| (9) |
The total length of the entire platooning sequence is expressed as equation (10).
| (10) |
3. Platooning System Architecture
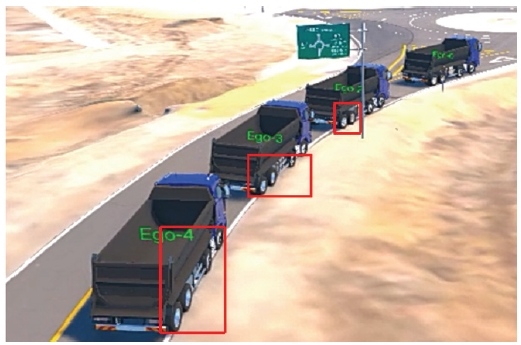
Platooning consisted of a total of 4 trucks. The truck platooning configuration using the MORAI simulator is shown in Fig. 3. MORAI19) simulator supports V2X communication module and can simulate real truck dynamo. In addition, since it can be linked with the ROS system in the Ubuntu environment, it is free to implement algorithms. The goal is to implement a stable platooning model by calculating the speed of trucks and the distance between vehicles by linking the proposed algorithm. All four trucks are the same truck Hyundai P540 model. Here, Ego - I(m) and Vi represent the location of the vehicle. The configured platooning was connected by V2X wireless communication. The method proposed in this paper is intended to explain the configuration of an environment for truck platooning vehicles to maintain a constant inter-vehicle distance at an optimal speed based on the leader vehicle. An integrated controller that integrates longitudinal and lateral controllers will be described below to support the optimal inter-vehicle length. Platooning system architecture.
3.1 Platooning System Configuration
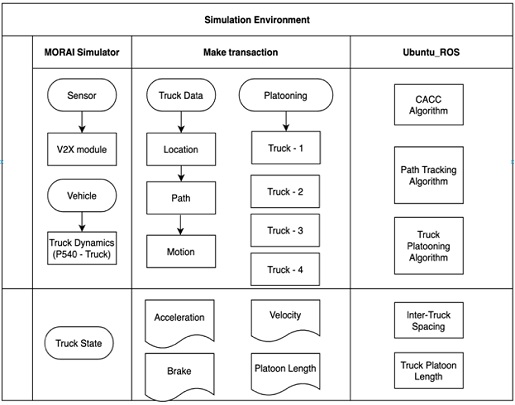
This paper designed the simulator architecture of the platooning system as shown in Fig. 4, using the MORAI autonomous driving simulator and the Ubuntu-ROS-based operating system. The MORAI autonomous driving simulator provides a truck model P540 and a Korean-style autonomous driving experimental K-City map. Truck platooning was implemented based on the provided sensor module information used for platooning. First, communication in the V2X sensor module provided by MORAI was used. The vehicle model used in the experiment is a Hyundai P540 truck, and all four are identical. Through this, all four trucks use communication to share messages. Table1 defines the data criteria required for CACC-based longitudinal and lateral integrated controller design using V2X communication.
3.2 Platooning Controller Architecture Configuration
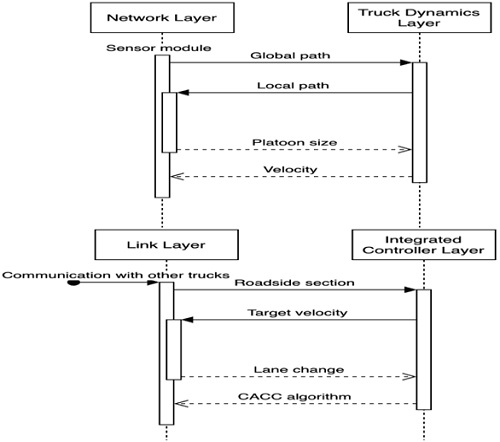
In this paper, the truck platooning controller is configured, as shown in Fig. 5. The network layer is a layer interlocked with the sensor module. Based on the information provided by V2X, global path information is provided to the truck dynamics layer. Here, the global path is the complete route information for the driving section(map). The Truck dynamics layer represents the status information of the truck. The status information of the car is included in Fig. 4. Local path information is provided to the network layer considering the current location of the car. The local path indicates a waypoint that can be moved from where the current truck is located. Platooning Controller Architecture Configuration.
Local path information, including the point way, is transmitted back to the network layer. The Network Layer that receives the local path checks the location of each truck and the number of trucks and specifies the size of the platooning queue. To maintain the set platooning queue size, the current speed of each truck is transmitted through the link layer. Link Layer is a feature that combines all information of different trucks. Trucks configured with platooning check the road section at the current location and provide the following trucks with lane change timing and characteristic information for each road section. The Integrated Controller Layer contains the integrated platooning control system. Based on the vehicle distance information between trucks provided from the Link Layer, the Platooning algorithm proposed in this paper is executed. According to each road section required for algorithm execution and the distance to the preceding vehicle, the target velocity is connected with the link layer. Stable truck platooning can be implemented as all layers operate organically. The next chapter 4 describes the truck platooning queue maintenance controller.
4. Integrated Controller System for Truck Platooning
Chapter 4 will explain the longitudinal and laterally integrated controllers in this paper based on the previously proposed Chapter 2 Dynamics. Chapter 3 will deal with the global path and local path information expressed in Fig. 5. Chapter 4 Also, the algorithm for truck platooning integrated controller will be explained.
4.1 Truck Path Information
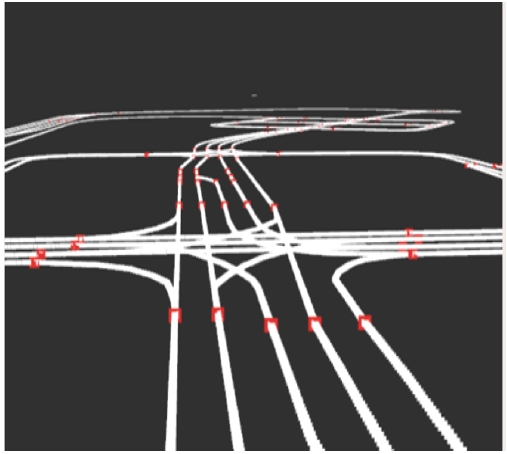
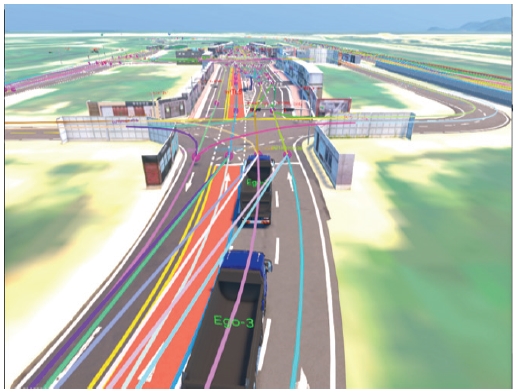
V2X-based trucks receive path information, as shown in Fig. 7 The information obtained here is Topological graph generation path information. In this paper, the figure displayed as an HD map is shown in Fig. 6. Data were stored for each node in the HD map. There are two types of stored data for each node. The first is the global path. The global path is the cost-based shortest path of the map that includes between the start point and the endpoint. The second is a local path. The local path is the path where the current truck is located. In this path, the time when lateral control is required can be calculated, and the information is transmitted to the integrated controller of Fig. 3. The line indicates the course requiring lateral control in Fig. 13. The situation in the simulation is shown in Fig. 7. It was applied to the next chapter, the integrated controller system, based on local path information on a road with a sharp curvature.
4.2 Integrated Controller System
Much research is being done on maintaining a rank in a lateral control situation during platooning consisting of trucks. The platooning currently being studied has difficulty in retaining the platooning positions on roads with sharp curvature. Since truck platooning in this paper acquires data based on V2X communication, it can utilize a more faster and more accurate algorithm application when platooning control. Based on this, we will describe a method that can better cope with the situation of a truck entering the roundabout abruptly in front of it compared to the general environmental sensor based ACC.
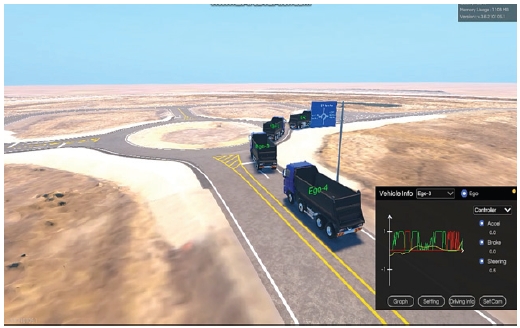
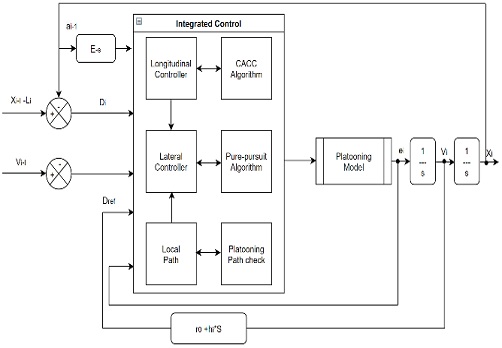
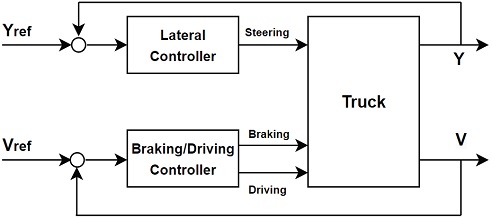
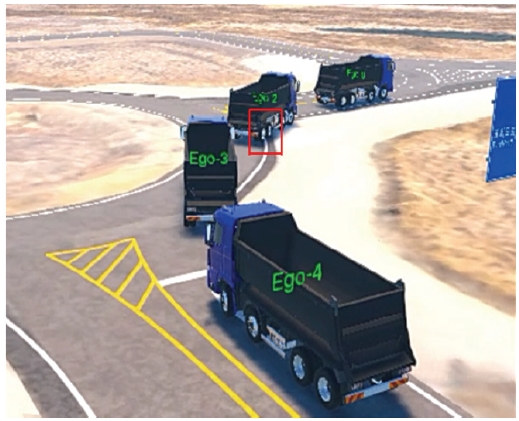
Fig. 8 shows the situation of entering a rotary with a sharp curvature of the MORAI simulator. To keep the platooning ranks stable, it is necessary to quickly respond to sudden changes in the driving environment, which is such a situation. The algorithm proposed in this study implements an integrated controller that integrates the CACC algorithm-based longitudinal controller and the Pure-pursuit algorithm-based lateral controller by utilizing the global path and local path. Fig. 9 shows the proposed integrated controller algorithm model. The distance between the vehicle and the front truck suggested in Chapter 2 and the global path and local path received from the link-layer stage indicated in Fig. 5 were used for the values used in this model. The V2X message set signal in Table 1 was used for the values used in the integrated controller. It was judged whether the truck in front was in the same lane as the trucks forming the line, and the logical value was determined based on the local path where the trucks are currently driving and the distance between the trucks in front. In addition, the truck platooning study was conducted under the assumption that the location of trucks constituting the platooning and the coordinates of surrounding vehicles were received using the truck platooning rank maintenance method proposed in Chapter 3 and V2X and Global Path.
Unlike the existing platooning algorithm, the integrated platooning control algorithm proposed in this paper is used to keep vehicles in a lane and drive them in a situation on the road with a sharp curvature. Based on the acceleration, speed, and relative distance to the preceding vehicle obtained through V2X, the controller was designed so that the distance error of the truck queue becomes 0. The longitudinal and lateral control of the car given as an input is implemented. The integrated controller defined that the vehicle in the truck queue is Ego-0, and the number increases by one as it goes backward. To realize the longitudinal and lateral direction integrated controller, the spacing error of the longitudinal control error was first defined as the following equation.
| (11) |
| (12) |
| (13) |
| (14) |
| (15) |
In the above equation, the inter-vehicle distance error Se and Vi represents the speed and acceleration error between the host and preceding vehicles. As shown in this value, it means the cumulative sum of distance errors between cars or trucks that exist in front of the own vehicle. δ0 is composed of the time gap, the preceding vehicle speed V, and the safe braking distance dref as shown in the above equation. According to previous studies, Truck drivers from the general fleet driver population were comfortable using the CACC system in mixed public traffic. They generally tended to prefer the intermediate gap settings over the longest and shortest settings, although there was a significant sub-group that preferred the shortest available setting(0.5 s time gap). When driving platooning with CACC, 0.5 seconds was adopted as the shortest time to reduce fuel consumption as a future study. In the widely-used CACC with a constant time gap(CTG) policy, the prevailing definition of time gap denotes the time it takes the subject vehicle to approach. its predecessor at the current speed. The safe braking distance means the distance from the vehicle in front when stopping, and the inter-vehicle distance was set to 5 m or more by referring to the standard for the ensemble.
4.3 Longitudinal and Lateral Control System Design
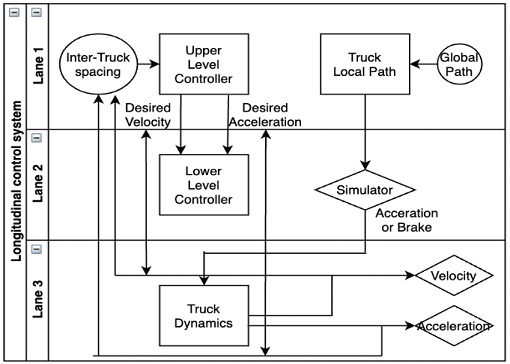
The longitudinal control system of truck platooning is composed mainly of upper-level controllers and lower-level controllers. Based on the above, the CACC20) algorithm is executed. The lower-level controller is responsible for the throttle and brakes of the truck. Inter-truck spacing refers to the distance between trucks. Accelerate based on the distance between trucks. The spacing between trucks is described in the next chapter. An upper-level controller is arranged as follows equations 16 and 17. In equation 16, i represents the number of trucks.
| (16) |
| (17) |
The method suggested in the paper of Distributed Consensus Algorithm for the CACC System21) was used. where the acceleration of vehicle 1 at time 4 is based on the absolute position difference and the velocity difference between itself with its preceding vehicle j. This algorithm takes the length cj and braking ability bi of different vehicles into account. Communication delay τij(t) is also included in the algorithm, making the system more realistic and applicable.
| (18) |
The upper-level controller sends the desired acceleration to the lower controller, and as a variable value to be used in the CACC algorithm, the connected lag is simulated as τ=0.5 s. It is included in the CACC algorithm module in Fig. 9. Inter-Truck Spacing was organized as equations 19, 20, 21, 22, 23 according to the constant spacing policy. The spacing policy is an implementation of the system as a method of keeping the distance between vehicle constant.
| (19) |
| (20) |
| (21) |
| (22) |
| (23) |
Next, the lower-level controller was organized as equations 24 and 25.
| (24) |
| (25) |
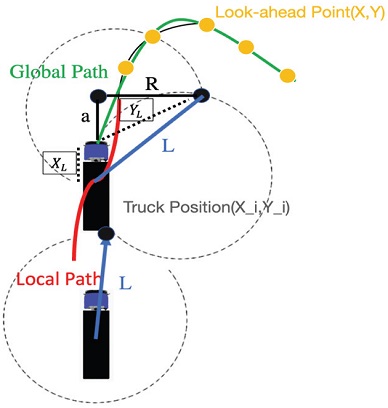
The characteristics of the lateral direction controller are pure-pursuit control and control according to the lateral travel estimation method based on global path and local path. In Fig. 10, the positions of the current trucks are represented by the global coordinate system(Xi, Yi). The global path of the lateral direction is read during truck platooning, and L indicates the constant look-ahead point. It is to find global coordinates X and Y, which are look-ahead points using L. In the lateral direction control method, the point connected to the arc’s center point to be moved from the current truck position is expressed as R. The above algorithm is summarized as equations 26, 27, 28, 29, 30. Next, the lower-level controller was organized as equations 24 and 25.
| (26) |
| (27) |
| (28) |
| (29) |
| (30) |
| (31) |
| (32) |
| (33) |
Calculate the angle value of the vehicle using the above algorithm. L is the wheelbase. Through the above equation, the desired steering value is shown in equation 33. Look-ahead Point was created on the global path to go with the above algorithm. Look-ahead Point makes 5 Points in advance based on the Local Path marked in red. An arc was drawn based on the created point, and pure-pursuit control was performed to reach the vehicle position on the path. As shown in Fig. 11, the proposed lateral control system that can stably maintain the platooning ranks in a situation where the road’s curvature is sharp is shown.
5. Platooning Driving Test Results
Chapter 5 verifies the performance of the truck platooning system developed in this paper and shows the results of comparative analysis. All target time gaps were set to 0.5 seconds, and the platooning speed of 80 km/h longitudinal and 35 km/h was considered. In addition, since the vehicle is controlled based on longitudinal and lateral direction information in this paper, we intend to evaluate the performance of the proposed algorithm by analyzing the results of relative longitudinal distance, longitudinal speed, and longitudinal acceleration. In addition, the experimental results are interpreted in Roundabout, a section in which platooning is continuously performed in the transverse direction. By analyzing the experimental results, it is verified whether platooning can stably form a rank even on a road section where the lateral movement is continuously performed. Platooning driving test results.
5.1 K-City Map Platooning Full Driving Route
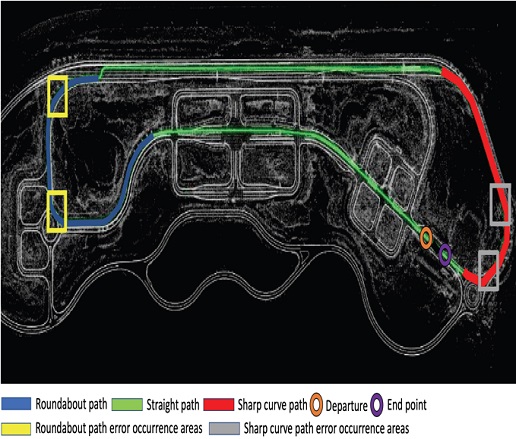
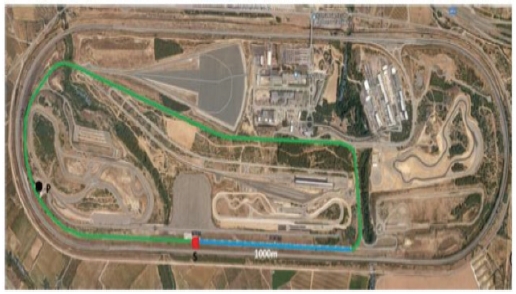
Fig. 13 is a map of K-City, a simulation-based Korean autonomous driving test bed that conducted the experiment. First, the platooning driving section was classified into three categories. The blue area is the roundabout path. Here, the lateral control test result is derived. The second section is a straight path section. Run the full speed test―finally, the sharp curve path section. Here, we proceed with the lateral control experiment. All areas are designated as platooning driving routes, and operating results from the driving starting point to the endpoint are derived.
5.2 Truck Platooning Driving Speed Results
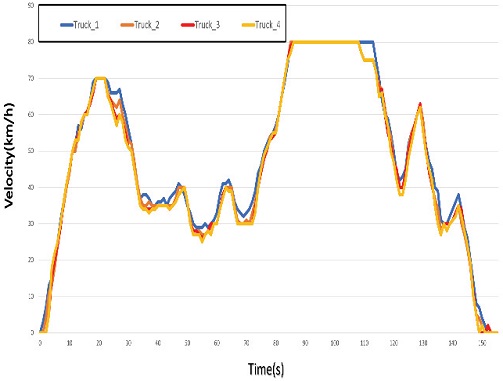
Fig. 14 shows the implementation speed of platooning for four trucks. It ran on the K-City map for 153 seconds and included straight sections, roundabouts, and roads with sharp curvatures. The experiment was conducted, including the maximum speed of 80 km/h that can be proceeded on the K-City road in the straight section. It shows that the platooning rate can be maintained stably and continuously even on the road with sharp curvature and in the roundabout section. The average speed of 4 trucks is as follows: Truck 1: 53.4 km/h, Truck 2: 52.22 km/h, Truck 3: 51.75 km/h, Truck 4: 51.56 km/h was maintained. Higher speeds also show that continuous platooning can be maintained.
5.3 Inter-spacing Results during Truck Platooning
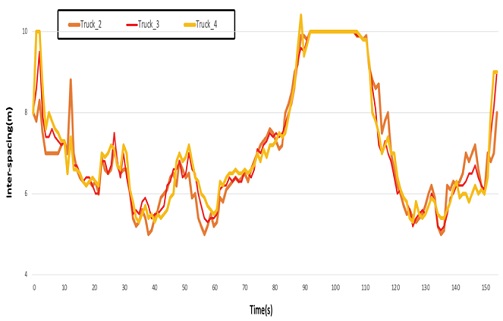
The inter-vehicle distance of truck platooning is shown in Fig. 15. The minimum distance while maintaining the truck platooning ranks was 5 m to 10 m. This results from the inter-vehicle distance according to maintaining a stable platooning rank by changing and maintaining the speed suggested by the integrated controller proposed in the longitudinal and lateral directions. The average inter-vehicle distance of Truck 2 is 7.05 m, the average inter-vehicle length of Truck 3 is 7.07 m, and the average inter-vehicle distance of Truck 4 is 7.12. we carried out.
5.4 Total Line Length Results during Truck Platooning
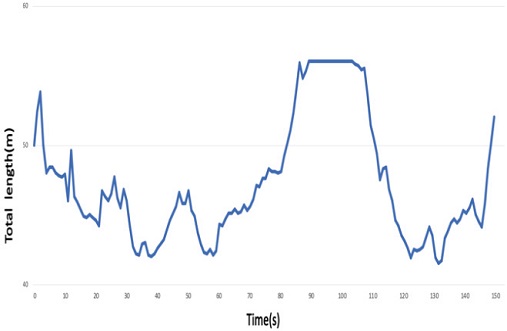
Fig. 16 shows the change in the total train length according to the truck platooning operation. It was confirmed that the ranks were kept stable through the integrated control of truck platooning.
5.5 Results of Truck Platooning on Roads with Sharp Curvature and Roundabouts
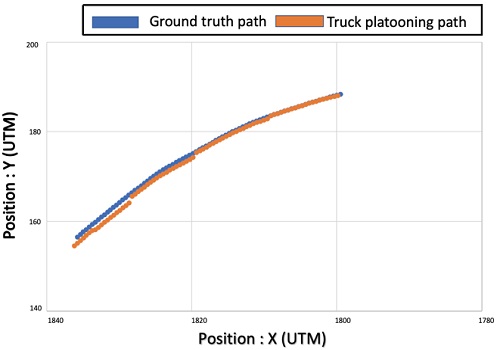
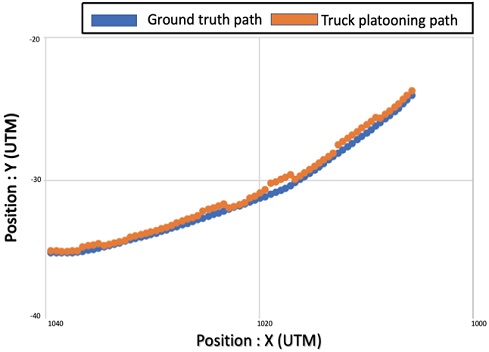
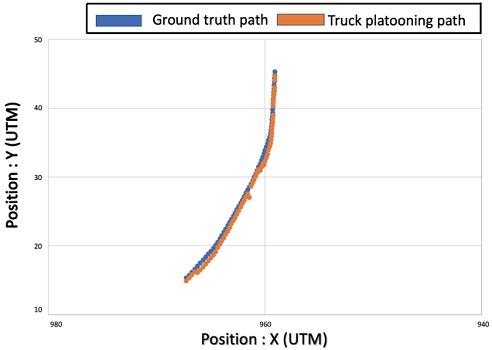
These are the control precision results for the roundabout path and sharp curve path classified in Fig. 13. Figs. 17, 18, 20, and 21 are shown by converting the driving routes of trucks in the HD map into coordinates. The absolute position coordinates of the HD map and the position of the truck currently located were displayed as two-dimensional points using UTM (Universal Transverse Mercator Coordinate System) coordinate transformation. The value was converted to the UTM-52 zone, which corresponds to K-City in Korea. In Table 2, the distance between the coordinates of the coordinates (X, Y) in the HD map and the coordinates of the current vehicle location (Xi, Yi) was calculated using the Euclidean distance. In addition, the maximum error was calculated for roads and rotary sections with sharp curvature, and the maximum allowable number of errors was calculated for the case where the error occurred larger than the average error. Roundabout error occurrence section.
Fig. 17 is the error corresponding to the first yellow box in Fig. 13 in the roundabout. Areas with significant errors during lateral control are enlarged and displayed. This is the same as stepping on the lane in Fig. 19.
Fig. 18 is the error corresponding to the second yellow box in Fig. 13 in the roundabout. Areas with significant errors during lateral control are enlarged and displayed. This is the same as stepping on the lane in Fig. 19. The graph is expressed with the coordinates (X, Y) of the HD map and the coordinates of the current truck location (Xi, Yi). The maximum error shows the lateral position error situation while driving in the rotary section in Fig. 19. That is, such a situation was calculated as the maximum allowable error number.
Fig. 19 is the driving result of the roundabout. For the transverse error, an average value of 0.84 m was derived using the Euclidean distance formula. The maximum error yielded a value of 1.16 m. The maximum error shows the lateral position error situation while driving in the rotary section in Fig. 18. The problem of stepping on the lane was calculated as the maximum allowable error number and indicated in Table 2.
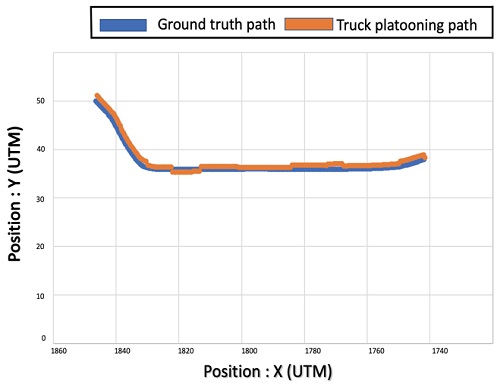
Fig. 20 and Fig. 21 are the error errors corresponding to the gray box in Fig. 13 in the sharp cruise path. Areas with large errors during lateral control are enlarged and displayed. This is the same as stepping on the lane in Fig. 22. The graph is expressed with the coordinates (X, Y) of the HD map and the coordinates of the current truck location (Xi, Yi). For the transverse error, an average value of 0.88 m was derived using the Euclidean distance. The maximum error was 1.24 m. The maximum error shows the lateral position error situation during sharp cruise path driving in Fig. 22. That is, such a situation was calculated as the maximum allowable error number.
Table 2 classifies the platooning driving section into three categories: a straight line, a road with sharp curvature, and a roundabout. The proposed integrated controller was used to maintain a stable lateral running speed even on roads with sharp curvatures and roundabouts. The corner sections were driven within the following error range. This experiment showed that it continuously maintains a speed higher than the maximum speed of 75 km/h for platooning conducted in the IDIADA experiment, a European ENSEMBLE project.18)
It shows stable platooning even on the road with a sharp curvature that requires lateral control. Also, the average inter-vehicle distance of Truck 2 is 7.05 m, the average inter-vehicle length of Truck 3 is 7.07 m and the average inter-vehicle distance of Truck 4 is 7.12 m. It performed continuous platooning at a narrower interval than the 8 m to 12.5 m distance between platoons tested on the IDIADA road of the European ENSEMBLE project. The experimental environment of the IDIADA project is shown in Fig. 23. The experimental results are shown in Table 3.
6. Conclusion
Existing platooning studies are expected in available vehicles and highways. This paper was interested in implementing platooning with trucks and proposed a way to solve traffic congestion on roads by implementing platooning with trucks. In addition, the scope of autonomous driving has been expanded by conducting experiments on public roads. One of the reasons it is difficult to maintain the ranks of platooning is that it is composed of environmental sensors such as GPS, camera, and lidar, so information and range are limited. To solve this problem, a V2X communication module is used and provides stable truck platooning. In other words, we proposed an integrated controller that acquires truck information through the V2X communication module and applies the knowledge to the longitudinal and lateral controllers by fusion. The integrated controller has formed a stable truck platooning rank from truck platooning to a longitudinal driving speed of 80km/h, which is the maximum speed allowed on public roads. Stable truck platooning was realized even at a lateral driving speed of 35 km/h. The distance between trucks was a minimum of 5 m and a maximum of 10 m. With integrated control, truck platooning confirmed that it was possible to drive not only roundabout but also on roads with sharp curvatures. Future research plans aim to reduce the distance between more trucks and vehicles. In addition, the ultimate goal is to realize platooning on any road by setting the vehicle speed change to various values.
- Video link : https://youtu.be/rHF3VYf-a88
- Git code link: https://github.com/geunnampark/Platooning
Nomenclature
| Ti : | leading truck |
| Ti-1 : | following truck |
| Li : | length of truck |
| Vi : | velocity of truck |
| Hi : | constant time headway |
| θ : | yaw rate |
| β : | truck sliding angle |
| φ : | yaw angular velocity |
| Di1 : | distance from preceding truck |
| Ei : | constant spacing policy error |
| Lplatoon : | total length of platooning |
| Se : | constant inter-spacing error |
| ev : | preceding vehicle velocity error |
| δdes : | required stable braking distance |
| δla(t) : | desired steering |
Subscripts
| ACC : | adaptive cruise control |
| CACC : | co-operative adaptive cruise control |
| V2X : | vehicle-to-x |
| ENSEMBLE : | enabling safe multi-brand platooning for Europe |
| K-City : | korean-style autonomous driving city |
Acknowledgments
This research was supported by the MOTIE(Ministry of Trade, Industry, and Energy) in Korea, under the Fostering Global Talents for Innovative Growth Program(P0008751) supervised by the Korea Institute for Advancement of Technology(KIAT).
This research was supported by the MSIT(Ministry of Science and ICT), Korea, under the Grand Information Technology Research Center support program(IITP-2021-2020-0-01462) supervised by the IITP(Institute for Information & communications Technology Planning & Evaluation).
References
-
S. Tsugawa, S. Jeschke and S. E. Shladover, “A Review of Truck Platooning Projects for Energy Savings,” IEEE Transactions on Intelligent Vehicles, Vol.1, No.1, pp.68-77, 2016.
[https://doi.org/10.1109/TIV.2016.2577499]

-
A. Vahidi and A. Eskandarian, “Research Advances in Intelligent Collision Avoidance and Adaptive Cruise Control,” IEEE Transactions on Intelligent Transportation Systems, Vol.4, No.3, pp.143-153, 2003.
[https://doi.org/10.1109/TITS.2003.821292]

-
V. Turri, Yeojun Kim, J. Guanetti, K. H. Johansson and F. Borrelli, “A Model Predictive Controller for Non-cooperative Eco-platooning,” 2017 American Control Conference (ACC), pp.2309-2314, 2017.
[https://doi.org/10.23919/ACC.2017.7963297]

-
S. Tsugawa, “An Overview on an Automated Truck Platoon within the Energy ITS Project,” IFAC Proceedings Volumes, Vol.46, No.21, pp.41-46, 2013.
[https://doi.org/10.3182/20130904-4-JP-2042.00110]

- X. Lu and S. Shladover, “Integrated ACC and CACC Development for Heavy-Duty Truck Partial Automation,” 2017 American Control Conference (ACC), pp.4938-4945, 2017.
-
P. Wang, B. Di, H. Zhang, K. Bian and L. Song, “Platoon Cooperation in Cellular V2X Networks for 5G and Beyond,” IEEE Transactions on Wireless Communications, Vol.18, No.8, pp.3919-3932, 2019.
[https://doi.org/10.1109/TWC.2019.2919602]

-
B. Tian, X. Deng, Z. Xu, Y. Zhang and X. Zhao, “Modeling and Numerical Analysis on Communication Delay Boundary for CACC String Stability,” IEEE Access, Vol.7, pp.168870-168884, 2019.
[https://doi.org/10.1109/ACCESS.2019.2954978]

-
S. C. Warnick and A. A. Rodriguez, “A Systematic Antiwindup Strategy and the Longitudinal Control of a Platoon of Vehicles with Control Saturations,” IEEE Transactions on Vehicular Technology, Vol.49, No.3, pp.1006-1016, 2000.
[https://doi.org/10.1109/25.845117]

-
T. S. No, K. T. Chong and D. H. Roh, “A Lyapunov Function Approach to Longitudinal Control of Vehicles in a Platoon,” IEEE Transactions on Vehicular Technology, Vol.50, No.1, pp.116-124, 2001.
[https://doi.org/10.1109/25.917894]

-
L. Xu, L. Y. Wang, G. Yin and H. Zhang, “Impact of Communication Erasure Channels on the Safety of Highway Vehicle Platoons,” IEEE Transactions on Intelligent Transportation Systems, Vol.16, No.3, pp.1456-1468, 2015.
[https://doi.org/10.1109/TITS.2014.2364114]

-
D. Jia, K. Lu and J. Wang, “A Disturbance-Adaptive Design for VANET-Enabled Vehicle Platoon,” IEEE Transactions on Vehicular Technology, Vol.63, No.2, pp.527-539, 2014.
[https://doi.org/10.1109/TVT.2013.2280721]

- L. Lan, R. Dianbo and Z. Jiye, “Terminal Sliding Mode Control for Vehicle Longitudinal Following in Automated Highway System,” 2008 27th Chinese Control Conference, pp.605-608, 2008.
-
A. Bayuwindra, J. Ploeg, E. Lefeber and H. Nijmeijer, “Combined Longitudinal and Lateral Control of Car-Like Vehicle Platooning With Extended Look-Ahead,” IEEE Transactions on Control Systems Technology, Vol.28, No.3, pp.790-803, 2020.
[https://doi.org/10.1109/TCST.2019.2893830]

- M. C. Won, “Longitudinal Vehicle Platoon Control in Intelligent Vehicle Highway Systems,” Transactions of KSAE, Vol.7, No.1, pp.209-218,1999.
-
R. Rajamani, H. S. Tan, B. K. Law and W. B. Zhang, “Demonstration of Integrated Longitudinal and Lateral Control for the Operation of Automated Vehicles in Platoons,” IEEE Transactions on Control Systems Technology, Vol.8, No.4, pp.695-708, 2000.
[https://doi.org/10.1109/87.852914]

- S. K. Gehrig and F. J. Stein, “A Trajectory-based Approach for the Lateral Control of Car Following Systems,” IEEE International Conference on Systems, Man, and Cybernetics, Vol.4, pp.3596-3601, 1998.
-
K. Tammi and V. Hyvärinen, “Lateral and Longitudinal Control of Bus Platoon,” 2018 IEEE International Conference on Electrical Systems for Aircraft, Railway, Ship Propulsion and Road Vehicles & International Transportation Electrification Conference (ESARS-ITEC), 2018.
[https://doi.org/10.1109/ESARS-ITEC.2018.8607431]

- ENSEMBLE, https://platooningensemble.eu/library, .
- MORAI, https://www.morai.ai, .
-
C. Chang and Z. Yuan, “Combined Longitudinal and Lateral Control of Vehicle Platoons,” 2017 International Conference on Computer Systems, Electronics and Control (ICCSEC), pp.848-852, 2017.
[https://doi.org/10.1109/ICCSEC.2017.8446824]

-
G. J. L. Naus, R. P. A. Vugts, J. Ploeg, M. J. G. van de Molengraft and M. Steinbuch, “String-stable CACC Design and Experimental Validation, a Frequency-domain Approach,” IEEE Transactions on Vehicular Technology, Vol.59, No.9. pp.4268-4279, 2010.
[https://doi.org/10.1109/TVT.2010.2076320]


