A Hole-to-hole Uniformity Evaluation from Multi-hole Direct-injection Gasoline Injector U sing S pray C ross-section Images
Copyright Ⓒ 2021 KSAE / 185-10
This is an Open-Access article distributed under the terms of the Creative Commons Attribution Non-Commercial License(http://creativecommons.org/licenses/by-nc/3.0) which permits unrestricted non-commercial use, distribution, and reproduction in any medium provided the original work is properly cited.
Abstract
DISI injectors are important for evaluating the spray uniformity of individual spray plumes in order to achieve spray control and fuel distribution. To measure the spray uniformity of individual spray plumes, it is essential to obtain data on the main spray characteristics of individual spray plumes. The narrow spray angle of the DISI injector makes it difficult to measure individual spray plumes; therefore, a new method using cross-sectional images is proposed. Using sheet beams and cross-sectional images of sprays, hole-to-hole spray uniformity can be analyzed via a repeatability evaluation of the acquired data. The proposed method was verified by applying it to two injectors with different hole arrangements and operating pressure ranges. A comparison of spray uniformity between the injectors was conducted. As a result, spray uniformity was investigated in terms of the correlations among individual spray center, spray area, and spray cone angle.
Keywords:
Spray uniformity, Spray cross-section, Individual spray plume, Spray center, Spray area, Spray cone angle1. Introduction
The direct-injection injector in an internal combustion engine has the advantages of easy fuel control and high injection response. Additionally, the direct-injection engine improves the torque, power, and fuel economy owing to latent heat of evaporation of the fuel, compared to the port-injection engine.1,2) Because of these advantages, the DIS Imethod is increasingly being for injection in gasoline engines, replacing the conventional port injection method.3-6) There are various types of DISI injectors, such as the pintle type, slit type, outwardly-opening type, and multi-hole type. Among them, the multi-hole type direct injection injector can easily distribute fuel and has excellent atomization characteristics; this type of injector is mainly applied to diesel engines.7-9) The spray characteristics of the injector significantly affect the quality of mixture, and precise fuel injection control is essential.10-13) Hole-to-hole analysis of multi-hole injectors is important for accurate spray targeting because the hole-to-hole characteristics vary depending on the design tolerance of the injector, behavior of the needle (or ball), hole arrangement, and deposit.14-18)
The hole-to-hole characteristics of diesel injectors with a symmetrical spray structure installed at the center of the combustion chamber have been investigated to analyze the fuel distribution and spray uniformity.19,20) However, the DISI injector is mounted on the side of the combustion chamber owing to the spark plug. Therefore, the DISI injector has a small injection angle and a non-symmetrical structure.5,7,21) For obtaining an accurate fuel distribution, hole-to-hole analysis is more important for a DISI injector with a non-symmetrical spray structure than for other injectors. However, owing to the small spray angle, interference occurs among the spray plumes injected from different hole when the spray is injected. Thus, DISI injectors have difficulty determining the hole-to-hole spray characteristics. To overcome this problem, the spray cross-sectional image technique for checking and comparing the distribution of fuel using section image of the spray has been used in recent years.4,22-27)
Dahlander and Lindgren23) studied how the hole arrangement of a multi-hole DISI injector affects the fuel distribution, air inflow and velocity, and turbulence formation using various methods, such as laser-induced fluorescence(LIF), Mie-scattering, phase Doppler anemometry (PDA) and computational fluid dynamics(CFD). The distance between the spray plumes has a greater effect on the mixture formation than the symmetry of the hole arrangement, and fluctuations between cycles can significantly affect the ignition stability in the combustion system. Wu et al.24) investigated the collapse process through an experimental study in which cross-sectional images of two injectors in a flash boiling condition were obtained. Wood25) confirmed that the spray collapse process occurs under the flash boiling condition by using a spray cross-sectional image. Befrui et al.26) and Das et al.27) verified the accuracy of spray targeting via CFD spray cross-sectional analysis and suggested methods for reducing the cost and time. Van Romunde et al.4) analyzed the effect of the fuel temperature by spraying various fuels of the DISI injector and conducting observations from a side view and a bottom view. When the atmospheric pressure was reduced to 0.5 bar in a non-collapsed condition, the spray tip penetration of all the fuels increased by 20-25 %, and the degree of reduction of the spray cone angle depended on the fuel temperature. As described above, various methods are applied to expand the width of spray analysis by using the spray cross-sectional images. However, unlike diesel injectors, GDI injectors lack research on hole-to-hole analysis. In addition, existing X-ray techniques capable of separating high concentrations of spray have limitations in terms of cost and time.
The objective of the present study was to propose a hole-to-hole spray uniformity evaluation method using the characteristics of individual spray plumes obtained through spray cross-sectional images. To validate the proposed method, it was applied to two different types of DISI injectors in experiments, and the spray uniformity was analyzed. By obtaining the deviation information of the spray center, spray area, and spray cone angle of individual spray plumes from the spray cross-sectional image, the spray uniformity of the two injectors was compared, and the characteristics of each injector were investigated.
2. Experimental Apparatus and Analysis Methods
2.1 Experimental Apparatus
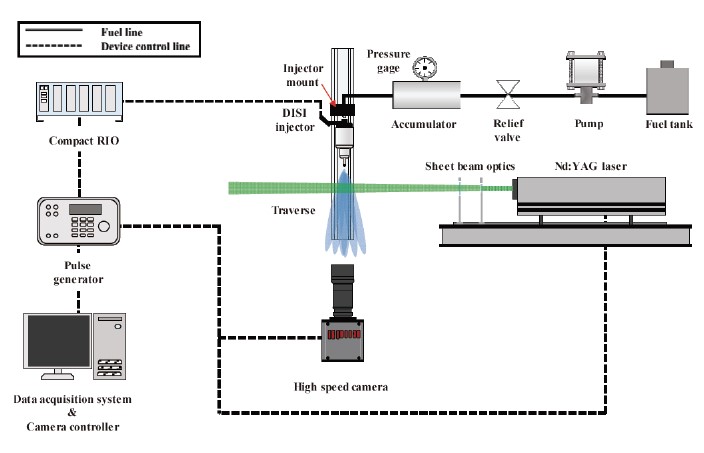
Fig. 1 shows a schematic of the spray pattern measurement system. The spray cross-sectional imaging device was composed of a fuel supply unit, an image acquisition unit, and a signal control unit. To pressurize the fuel in the fuel supply unit, a pneumatic pump(Haskel, DSF-60) was used, and the fuel was stored in an accumulator to maintain the pressure. The injector was controlled using a CompactRIO controller(NI, cRIO-9030), a differential digital input(NI, 9411), and an injector controller(NI, 9751). The image acquisition unit comprised a high-speed camera(FASTCAM, Mini A X100), a l ens(SIGMA, 105 mm f / 1 : 2.8 DG MACRO HSM) and a Nd:YAG laser(Continuum, SL2-100) with a wavelength of 532 nm. Optics were combined to generate a sheet beam to obtain a spray cross-sectional image. In the signal control unit, a pulse generator(Berkeley Nucleonics Corps., Model 577) was used for signal control and synchronization of the high-speed camera, injector, and laser. The obtained spray image was processed in the order of background removal, black-and-white processing, binarization, and filtering using a MATLAB based in-house program. Quantitative data such as the spray center, spray area, and spray cone angle were extracted using the coordinates of the spray in the processed spray cross-sectional image.
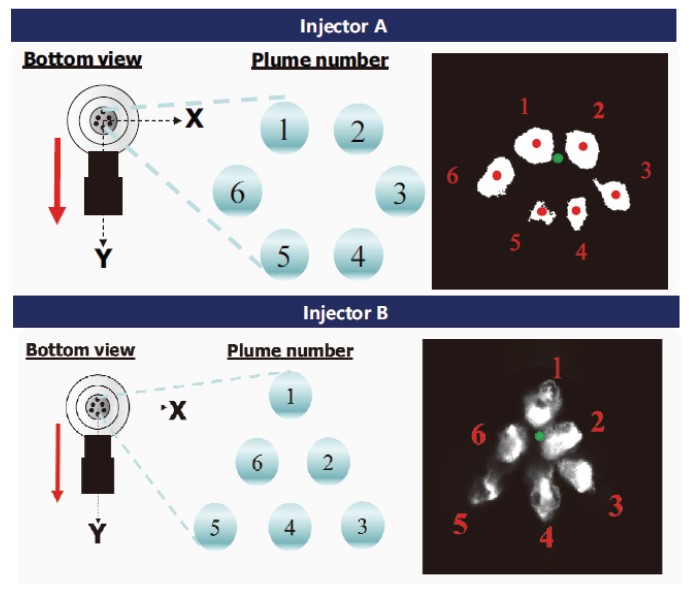
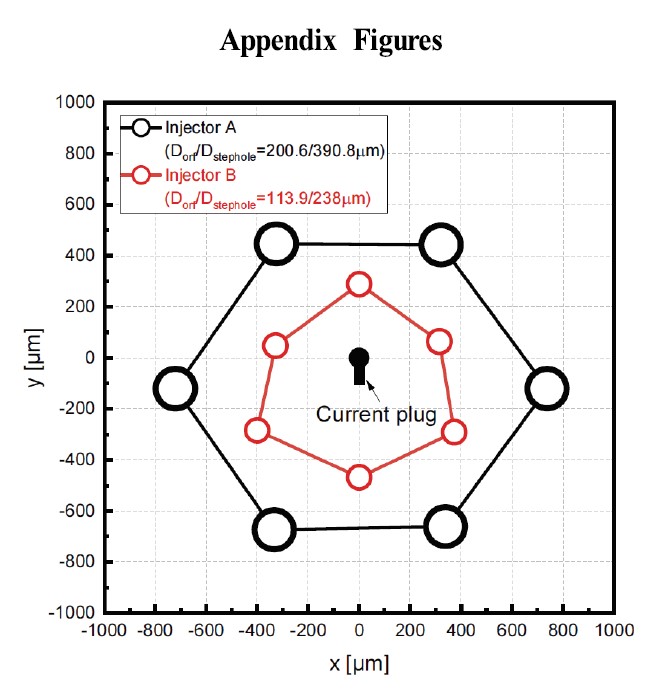
To verify the spray uniformity measurement method, it was applied to two types of six-hole DISI injectors with different hole diameters and orifice arrangements. Injectors A and B could be used up to maximum injection pressure of 20 MPa and 35 MPa, respectively. The hole arrangement and an example spray cross-sectional image are shown in Fig. 2. The detailed location and diameter of a hole are shown in App. A.10) The orifice and step hole diameter for injector A was approximately 2 times larger than that for injector B. Further, injector A had a hexagonal symmetrical hole arrangement, and the average hole-to-hole distance was 960.2 μm. Injector B had a triangular symmetrical hole arrangement, and the average hole-to-hole distance was 540.5 μm. The spray uniformity was measured using two completely different DISI injectors from the allowable injection pressure to the hole structure to validate the proposed measurement method.
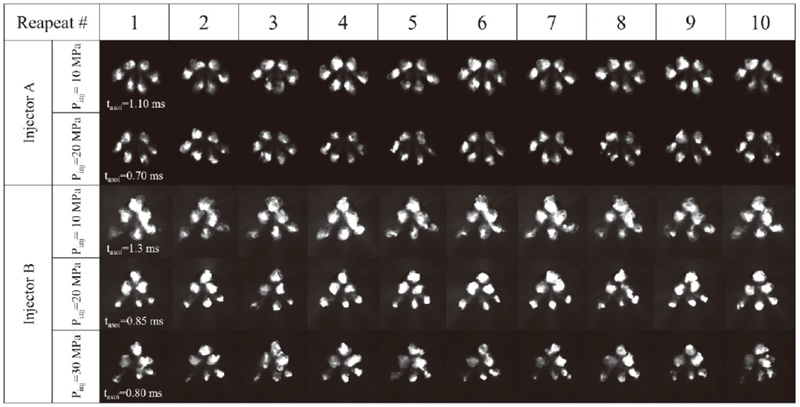
Fig. 3 shows the spray cross-sectional images for injectors A and B arranged under the same injection conditions. Because the diameter and arrangement of the holes differed between the two injectors, the spray patterns differed. Additionally, even though the injection conditions were identical, the individual spray plumes exhibited different shapes. By using the characteristics of the individual spray plumes, which were different, the spray uniformity of the individual spray plumes according to various injection conditions in each injector was evaluated.
2.2 Experimental Conditions
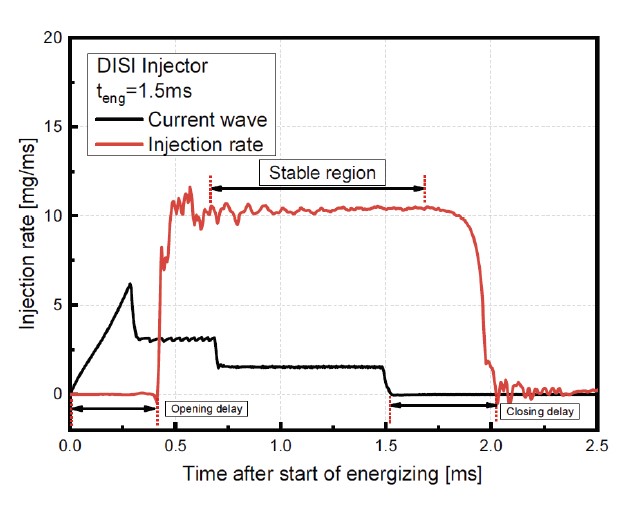
Table 1 presents the experimental conditions for measuring the spray cross-sectional images. In the experiment, the injection pressure was increased by 20 MPa for injector A and by 30 MPa for injector B. The ambient pressure was set as the atmospheric pressure, and the energizing duration was set as 1.5 ms, which was sufficient for stable injection of the fuel of the DISI injector. An example graph of the injection rate for an energizing duration of 1.5 ms is presented in App. B. As shown, there was a stable section sufficient for acquiring a spray cross-sectional image. When the distance from the injector tip to the measurement cross-section was less than 30 mm, the spray was not sufficiently developed, and the overlap of the spray was severe; thus, it was difficult to separate the individual spray plumes. When the distance exceeded 60 mm, the droplets were dispersed owing to the scattering of the spray, and the boundary of the spray was unclear; thus, it was difficult to capture the spray cross-sectional image. Therefore, the distance from the injector tip to the measurement cross-section was increased from 30 to 60 mm in 5 mm increments to obtain and spray cross-sectional images.
2.3 Spray Uniformity Evaluation Method Using Spray Center, Spray Area and Spray Cone Angle
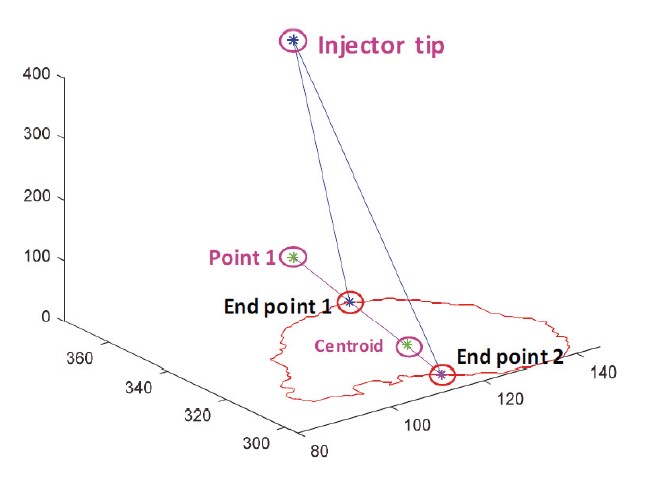
The spray center, spray area, and spray cone angle of the individual spray plumes of the spray cross-sectional image obtained using the MATLAB based in-house program were determined. Schematics of the spray center, spray area, and spray cone angle of individual spray plumes and the definition of the offset spray angle are shown in Fig. 4. The spray center and spray area of the individual spray plumes were calculated by separating the area where the spray existed. The method for measuring the spray angle was presented in a previous report.22) App. C shows a schematic of the method used for measuring the spray cone angle of individual spray plumes. End points 1 and 2 were created using a straight line connecting the center of the individual spray plume with point 1 projecting the injector tip onto the spray cross-sectional plane.
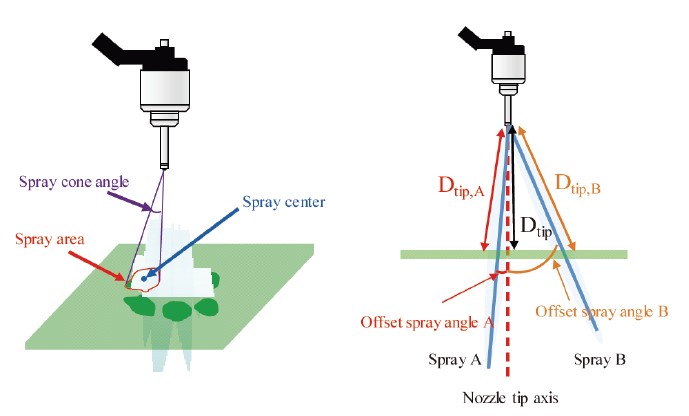
Schematic showing (a) definitions of individual spray plume characteristics and (b) definition of the offset spray angle
The spray cone angle of the individual spray plumes was then obtained using the coordinates of the injector tips and end points 1 and 2. Using the data obtained by repeating the injection 100 or more times under the same conditions, it was possible to evaluate the uniformity of individual spray plumes according to the average and deviation data. The offset spray angle was the angle between the axis of the nozzle tip and the central axis of the spray plume, and Dtip (distance from nozzle tip) was the straight distance from the injector nozzle tip to the spray cross-section measurement area. An example of two spray plumes with different offset spray angles is shown in Fig. 4(b). Spray A exhibited a smaller offset spray angle than Spray B. As in most DISI injectors, the spray was asymmetric; thus, each spray plume had various offset spray angles, as in the example. Therefore, spray A with a small offset spray angle had a relatively short Dtip,A(distance from the nozzle tip to the measurement cross-section of injector A). Spray B with a large offset spray angle had a relatively long Dtip,B(distance from the nozzle tip to the measurement cross-section). Therefore, because spray B with more developed than spray A is measured, even if the injection is performed under the same conditions in the same injector, a large spray offset angle may reduce the spray uniformity.
By comparing the variation of the spray area and the spray angle, the uniformity of the spray plume of each injector was evaluated. However, because the hole diameter and offset spray angle differed between the injectors, it was impossible to objectively compare the uniformity of different holes or injectors. Therefore, the final Uarea(spray uniformity based on spray area) and Uang(spray uniformity based on spray cone angle) values were obtained through normalization, by dividing the deviation of the data by the average value. By applying normalization, the unique deviations of each injector are divided by the average value to make the result values of different injectors into a comparable index.
3. Results and Discussion
3.1 Spray Uniformity Analysis Using Spray Center Deviation
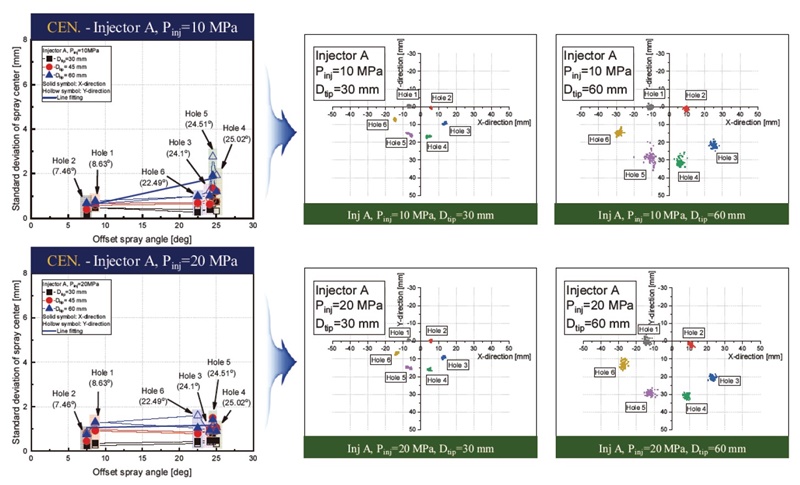
Fig. 5 shows the deviation of the individual spray plume center for injector A. The deviations at each measurement position are indicated by symbols, and the deviation of the spray center according to the offset spray angle was linearly fitting and shown as a blue solid line. The deviation of each spray center under spray pressures of 10 and 20 MPa and Dtip values of 30, 45, and 60 mm was expressed by dividing by the θoffset of each spray plume. As Dtip increases at the injection pressure of 10 and 20 MPa, the spray develops and scatters in several directions, so most spray plumes increase the deviation of the spray centers in the X and Y directions. As the Dtip increased from 30 mm to 60 mm, the deviation of spray center increased 189.8 % on average at Pinj=10 MPa and 189.3 % on average at Pinj=20 MPa. As the offset spray angle increased at the injection pressure of 10 MPa, the spray distance from the injector tip to the measured cross section increased by ∼ 9 %; thus, the spray droplets lost straightness and the spray center deviation increased. The spray center deviation for holes 4 and 5 with a large offset spray angle also decreased, because the spray droplets at an injection pressure of 20 MPa were developed with greater momentum than 10 MPa. Therefore, for injector A, as the injection pressure increased, the spray center deviation of the spray plums with a large offset spray angle decreased. The hole-to-hole variation of the spray center deviation was reduced. Consequently, injector A increased the uniformity between the spray plumes at the injection pressure of 20 MPa. Although there is a target injection pressure designed for each injector, it is judged that optimum injection conditions exist for uniformity in each injector.
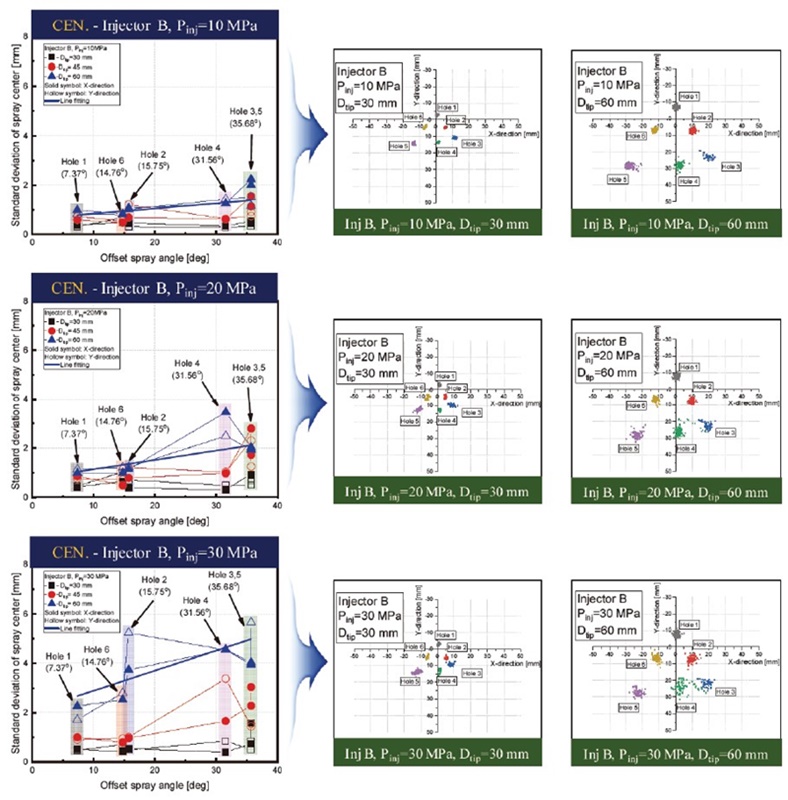
The spray center deviation of injector B is shown in Fig. 6. Injector B was also a six-hole injector, with different orifice design angles. Therefore, the spray center deviation was investigated according to the offset spray angle. As with injector A, the deviation of the spray center increased as the offset spray angle increased. However, for injector B, when the injection pressure increased from 10 MPa to 30 MPa, the spray center deviation increased, and the spray uniformity decreased for all holes. In particular, the deviation increased rapidly at Dtip=60 mm. This is because the spray droplets of injector B having a small orifice diameter encountered a large air resistance owing to atomization at a high injection pressure and were scattered in various directions. However, near the injector tip(e.g., Dtip=30 mm), the spray droplet still had a large amount of momentum; thus, even if the injection pressure increased, this did not significantly affect the spray uniformity. To analyze the characteristics of injector B in more detail, it was necessary to examine the normalized spray area deviation and spray cone angle deviation.
3.2 Spray Uniformity Analysis Using Spray Area Deviation
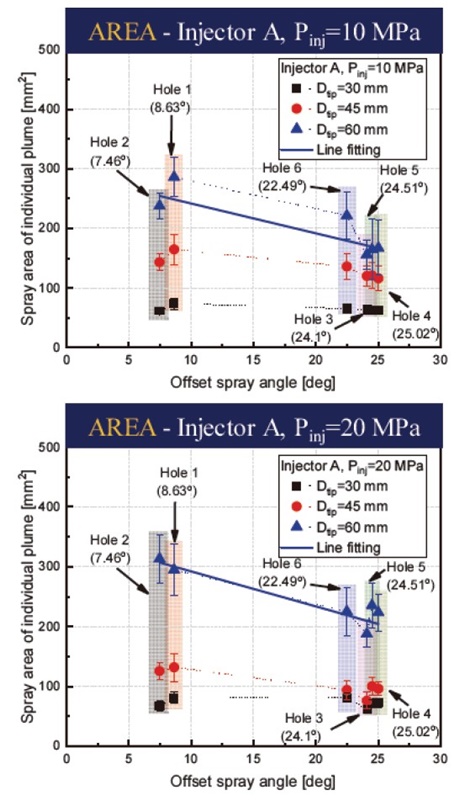
Before evaluating the spray uniformity using the spray area deviation of the individual spray plumes, the area of the individual spray plumes of injector A under each spray condition were examined, as shown in Fig. 7. When Dtip increased at injection pressures of 10 and 20 MPa, the spray area increased. When Dtip was 45 mm, the spray area decreased as the injection pressure increased. A spray plume with a large offset spray angle is observed with a less developed spray cross-section because the distance from the nozzle tip to the measuring cross-section is far.
Accordingly, as the offset spray angle increased, the spray area tended to decrease. Because the spray area was affected by the offset spray angle, Dtip and the injection pressure, the spray area deviation was normalized to evaluate the sprayuniformity.
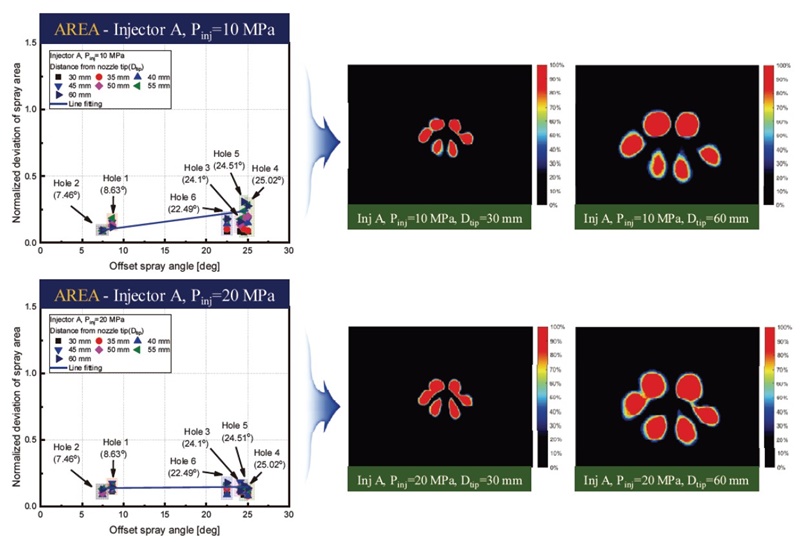
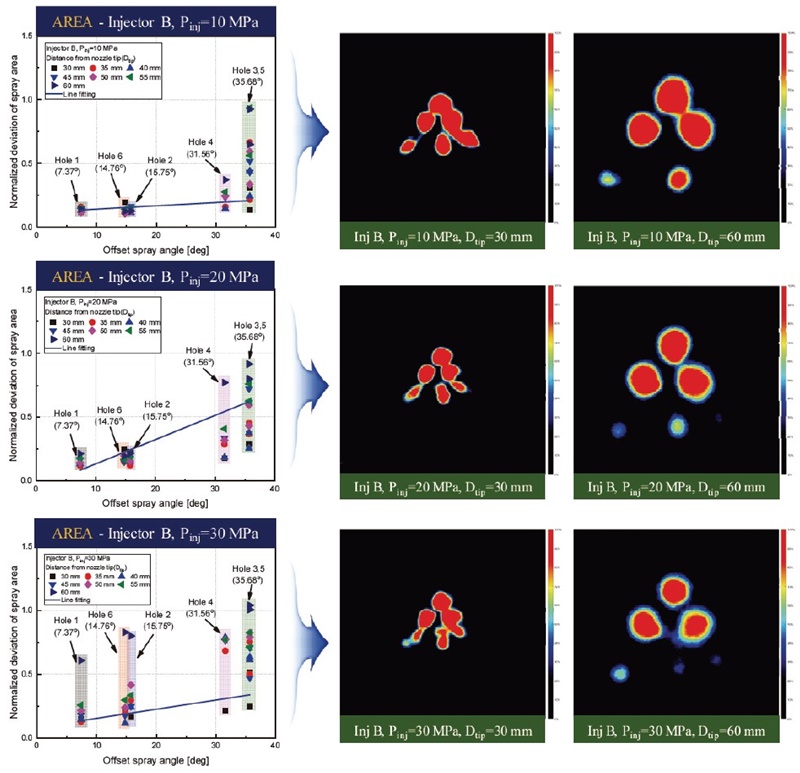
Fig. 8 shows the normalized deviation of the spray area. Dtip was increased from 30 to 60 mm in increments of 5 mm, and the deviation was grouped according to the offset spray angle. As Dtip increased, the deviation of the spray area tended to increase. As the offset spray angle increased at the injection pressure of 10 MPa, the spray area decreased, but the normalized spray area deviation increased. At a spray pressure of 20 MPa, the shot-to-shot variation of the spray plume with a large offset spray angle(e.g., holes 4 and 5) was reduced. Consequently, the overall hole-to-hole variation was reduced. The results of the spray uniformity analysis based on the spray area agreed well with those of the spray uniformity analysis based on the spray center.
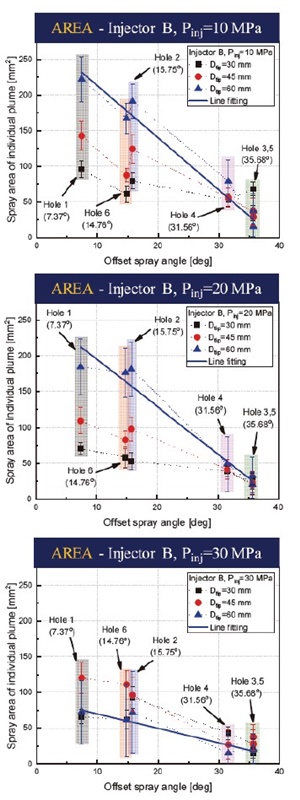
The spray area and normalized spray area deviation of injector B are shown in Figs. 9 and 10, respectively. Injector B had a triangular hole arrangement. The offset spray angle of injector B ranged from 7.37° to 35.68°. The distribution of the offset spray angle was wider for injector B than injector A. Therefore, as shown in Fig. 9, the spray area decreased rapidly as the offset spray angle increased. When the injection pressure increased from 10 to 20 MPa, the average spray area decreased slightly for all holes. However, when the injection pressure increased from 20 to 30 MPa, the spray area for the holes with a small offset spray angle at Dtip=60 mm was significantly reduced. This is because atomization of the spray droplets caused them to evaporate or scatter, and the area of the spray droplets decreased rapidly. However, as shown Fig. 10, despite the small spray area the deviation of the normalized spray area was significant. The average absolute value of the spray area did not significantly affect the spray uniformity. Unlike injection pressure 10, 20 MPa, injector B shows a sharp decrease in spray uniformity at Dtip=60 mm for injection pressure of 30 MPa. Since the injector B has a small nozzle hole, the diameter of the spray droplet decreases as the injection pressure increases. Therefore, in the areas where Dtip and Pinj are large, the spray droplets are scattered in all directions, and the spray uniformity obtained using the spray area is rapidly reduced.
3.3 Spray Uniformity Analysis Using Spray Cone Angle Deviation
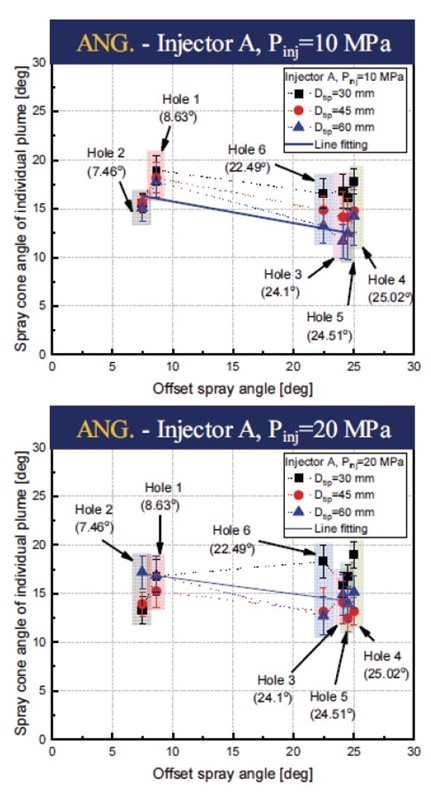
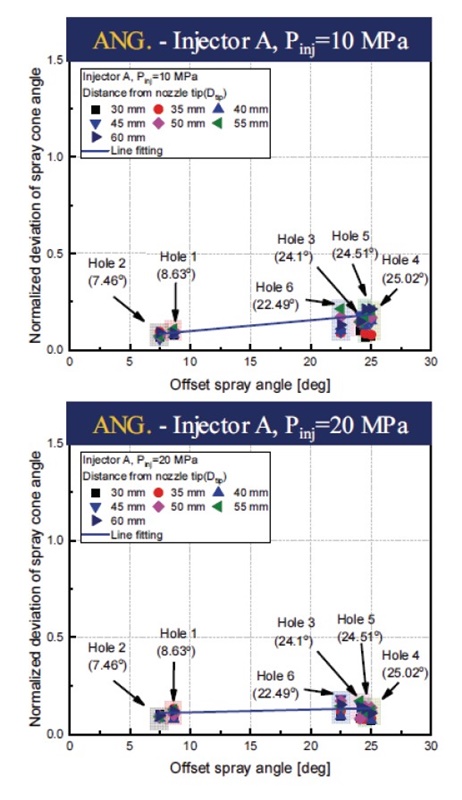
Fig. 11 shows the average spray angle of each individual spray plume of injector A. With the increasing offset spray angle, because the distance from the injector tip to the measuring cross-section increased, the spray cone angle and spray area tended to decrease. However, when the injection pressure increased to 20 MPa, the effect of the offset spray angle became meaningless, because the straightness increased owing to the large momentum of the spray droplet.28) For a more objective comparison, the normalized spray angle deviation of each individual spray plume was examined, as shown in Fig. 12. The spray cone angle deviation was large for the spray plumes with a large offset spray angle. When the injection pressure was increased to 20 MPa, the deviation of the spray cone angle with a large offset spray angle was slightly reduced. Therefore, for injector A, the spray droplet had a large amount of momentum when the injection pressure increased from 10 to 20 MPa; thus, the spray had high linearity in the axial direction and the spray uniformity increased. Additionally, the spray uniformity evaluated using the spray cone angle exhibited the same trends as that measured using the spray center and spray area.
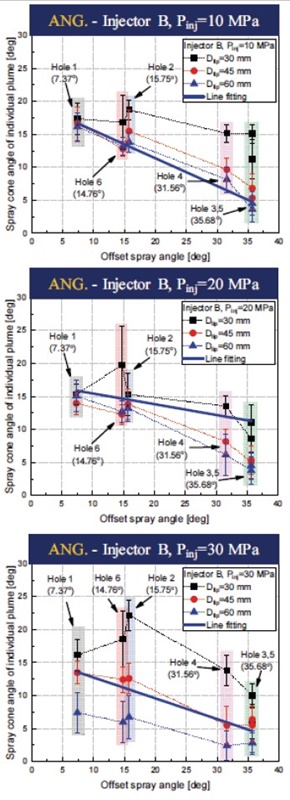
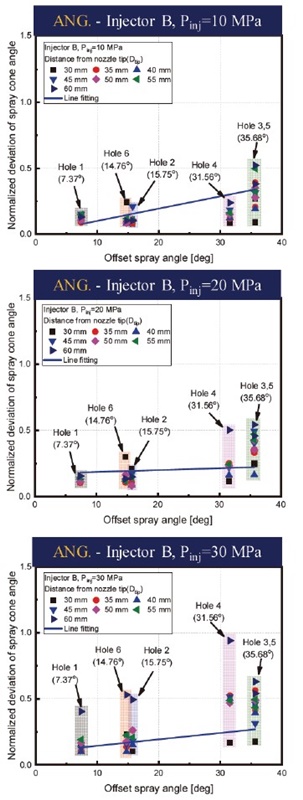
The results of the spray uniformity evaluation using the spray cone angle of injector B are shown in Figs. 13 and 14. Fig. 13 shows the individual spray cone angle for injector B. At all injection pressures, the spray cone angle decreases as Dtip increased. However, when the injection pressure increased, the dependence of the spray cone angle on Dtip increased, and the spray cone angle at an injection pressure of 30 MPa was relatively unstable. The deviation of the spray angle was also normalized for injector B. As shown in Fig. 14, the spray uniformity was confirmed using the spray cone angle. As shown in Figs. 6 and 10, when the injection pressure increased to 30 MPa, the deviation significantly increased, particularly at Dtip=60 mm. This was confirmed by the spray cone angle deviation. Injector B was stably injected up to an injection pressure of 20 MPa, and the spray uniformity decreased owing to the atomization of the spray droplets at an injection pressure of 30 MPa. The spray uniformity characteristics evaluated using the spray cone angle agreed well with those based on the spray center and spray area.
3.4 Evaluation of Spray Uniformity Measurement Method
To evaluate the uniformity measurement method for the individual spray plumes of the DISI injector, the spray uniformity was analyzed for two different injectors. The tendencies of the spray uniformity identified by using three characteristics(the spray center, spray area and spray cone angle) a greed well. Injectors A and B both performed injection stably when the injection pressure was 20 MPa or less. However, the spray uniformity of injector B decreased slightly owing to the atomization and scattering of the spray droplets at the injection pressure of 30 MPa. As the injection pressure increased from 10 MPa to 30 MPa, the results calculated using the spray center, spray area and spray cone angle showed that the average deviations increased by 103.1 %, 125 %, and 99.6 %, respectively. As mentioned previously, the uniformity of the individual spray plumes differed between the DISI injectors, and it was possible to understand the injector uniformity characteristics according to the injection conditions.
Additionally, the normalized data obtained by applying this research method to DISI injectors with various L/D values, step hole shapes, hole arrangements or structures, and injection pressures, can be analyzed to obtain the absolute index of the uniformity of individual spray plumes for DISI injectors.
4. Conclusion
The spray center, spray area, and spray cone angle of individual spray plumes were analyzed using spray cross-sectional images to overcome the difficulty of analyzing individual spray plumes due to the small injection angle of the DISI injector. Through a shot-to-shot analysis of these features(spray center, spray area, and spray cone angles), the spray uniformity of the injector was analyzed, and the following results were obtained.
- 1) The spray uniformity was evaluated using the characteristics of the individual spray plumes(spray center, spray area and spray cone angle) acquired from spray cross-sectional images. The method for evaluating the spray uniformity was validated using two injectors with different hole structures and arrangements. For both injectors A and B, the spray uniformity was accurately measured under the conditions in which the spray images were acquired.
- 2) Even though each injector was injected under the same injection conditions, there was a difference in spray uniformity between spray plumes with different spray offset angles. Injector A became more stable as the injection pressure increased, because the difference in uniformity between individual spray plumes decreased. However, injector B exhibited different characteristic, as the diameter of the spray droplets was significantly reduced owing to the very small hole diameter. The spray uniformity decreased when the injection pressure increased because the spray droplets were scattered in various directions without encountering the resistance of the surrounding air. Thus, it was possible to analyze the unique spray characteristics according to the hole arrangement and structure of each injector.
- 3) The spray uniformity was evaluated using the deviation of the spray center, spray area, and spray cone angle for the individual spray plumes. The normalized data can be used to objectively compare the spray uniformity regardless of the type of injector and the injection conditions. The spray uniformity values measured using the three methods agreed well. By performing further studies in which spray uniformity evaluation methods are applied to DISI injectors with different L/D values, step hole shapes, and hole arrangements, an absolute index for evaluating the spray uniformity under various conditions can be obtained.
Nomenclature
| L : | length |
| Dtip : | measuring distance from injector tip |
| θoffset : | offset spray angle |
| teng : | time after start of energizing |
| Uarea : | spray uniformity using spray area |
| Uang : | spray uniformity using spray cone angle |
Acknowledgments
This study was financially supported by the Basic Science Research Program(2019R1A2C1089494) through the National Research Foundation of Korea(NRF) funded by the Ministry of Education(Korea) and the Center for Environmentally Friendly Vehicle(CEFV) as the Global-Top Project of KMOE(Ministry of Environment, Korea) (2019002070001).
References
- N. M. Narasimhamurthy, W. Atkinson, Z. Yang and J. Naber, “Influence of Elevated Injector Temperature on the Spray Characteristics of GDI Sprays,” SAE 2019-01-0268, 2019.
- S. H. Park, H. J. Kim, H. K. Suh and C. S. Lee, “Atomization and Spray Characteristics of Bioethanol and Bioethanol Blended Gasoline Fuel Injected Through a Direct Injection Gasoline Injector,” International Journal of Heat and Fluid Flow, Vol.30, No.6, pp.1183-1192, 2009.
- A. A. Reddy and J. M. Mallikarjuna, “Parametric Study on a Gasoline Direct Injection Engine - A CFD Analysis,” SAE 2017-26-0039, 2017.
- Z. van Romunde, P. Aleiferis, R. Cracknell and H. Walmsley, “Effect of Fuel Properties on Spray Development from a Multi-hole DISI Engine Injector,” SAE 2007-01-4032, 2007.
- H. Guo, H. Ding, Y. Li, X. Ma, Z. Wang, H. Xu and J. Wang, “Comparison of Spray Collapses at Elevated Ambient Pressure and Flash Boiling Conditions Using Multi-hole Gasoline Direct Injector,” Fuel, Vol.199, pp.125-134, 2017.
- H. Guo, B. Wang, Y. Li, H. Xu and Z. Wu, “Characterizing External Flashing Jet from Single-hole GDI Injector,” International Journal of Heat and Mass Transfer, Vol.121, pp.924-932, 2018.
- K. Nishida, J. Tian, Y. Sumoto, W. Long, K. Sato and M. Yamakawa, “An Experimental and Numerical Study on Sprays Injected from Two-hole Nozzles for DISI Engines,” Fuel, Vol.88, No.9, pp.1634-1642, 2009.
- Y. Li, X. S. Bai, M. Tunér, H. G. Im and B. Johansson, “Investigation on a High-stratified Direct Injection Spark Ignition (DISI) Engine Fueled with Methanol Under a High Compression Ratio,” Applied Thermal Engineering, Vol.148, pp.352-362, 2018.
- S. Jo, S. Park, H. J. Kim and J. T. Lee, “Combustion Improvement and Emission Reduction Through Control of Ethanol Ratio and Intake Air Temperature in Reactivity Controlled Compression Ignition Combustion Engine,” Applied Energy, Vol.250, pp.1418-1431, 2019.
- M. Chang, J. H. Park, H. I. Kim and S. Park, “Flash Boiling Macroscopic Spray Characteristics of Multi-hole Direct Injection Injectors with Different Hole Arrangement,” Applied Thermal Engineering, Vol.170, Paper No.114969, 2020.
- M. Chang and S. Park, “Evaporation Characteristics of Ethanol as Alternative Fuel in Direct Injection Injector Under High-temperature Conditions,” Fuel, Vol.252, pp.427-438, 2019.
- B. Kim and S. Park, “Effect of Orifice Inlet Roundness on Internal Flow and External Spray Characteristics in Enlarged Nozzle with Single-passage,” Experimental Thermal and Fluid Science, Vol.109, Paper No.109875, 2019.
- B. Kim and S. Park, “Study on In-nozzle Flow and Spray Behavior Characteristics Under Various Needle Positions and Length-to-width Ratios of Nozzle Orifice Using a Transparent Acrylic Nozzle,” International Journal of Heat and Mass Transfer, Vol.143, Paper No.118478, 2019.
- T. Luo, S. Jiang, A. Moro, C. Wang, L. Zhou and F. Luo, “Measurement and Validation of Hole-to-hole Fuel Injection Rate from a Diesel Injector,” Flow Measurement and Instrumentation, Vol.61, pp.66-78, 2018.
- R. Payri, S. Molina, F. Salvador and J. Gimeno, “A Study of the Relation Between Nozzle Geometry, Internal Flow and Sprays Characteristics in Diesel Fuel Injection Systems,” Journal of Mechanical Science and Technology, Vol.18, No.7, pp.1222-1235, 2004.
- W. Zhang, Z. Zhang, X. Ma, O. I. Awad, Y. Li, S. Shuai and H. Xu, “Impact of Injector Tip Deposits on Gasoline Direct Injection Engine Combustion, Fuel Economy and Emissions,” Applied Energy, Vol.262, Paper No.114538, 2020.
- A. Cavicchi, L. Postrioti, F. Berni, S. Fontanesi and R. D. Gioia, “Evaluation of Hole-specific Injection Rate Based on Momentum Flux Measure- ment in GDI Systems,” Fuel, Vol.263, Paper No.116657, 2020.
- A. Miyajima, Y. Okamoto, Y. Kadomukai, S. Togashi and M. Kashiwaya, “A Study on Fuel Spray Pattern Control of Fuel Injector of Gasoline Direct Injection Engines,” SAE 2000-01-1045, 2000.
- Y. Lei, J. Liu, T. Qiu, J. Mi, X. Liu, N. Zhao and G. Peng, “Effect of Injection Dynamic Behavior on Fuel Spray Penetration of Common-rail Injector,” Energy, Vol.188, Paper No.116060, 2019.
- J. M. Desantes, J. V. Pastor, J. M. García-Oliver and F. J. Briceño, “An Experimental Analysis on the Evolution of the Transient Tip Penetration in Reacting Diesel Sprays,” Combustion and Flame, Vol.161, No.8, pp.2137-2150, 2014.
- N. Mitroglou, J. M. Nouri, Y. Yan, M. Gavaises and C. Arcoumanis, “Spray Structure Generated by Multi-Hole Injectors for Gasoline Direct-Injection Engines,” SAE 2007-01-1417, 2007.
- J. Park, J. H. Park and S. Park, “Study on Individual Spray Plume Characteristics of Multi- hole Direct Injection Spark Ignition (DISI) Injector Using Cross-sectional Area,” Fuel, Vol.262, Paper No. 116329, 2020.
- P. Dahlander and R. Lindgren, “Multi-hole Injectors for DISI Engines: Nozzle Hole Configuration Influence on Spray Formation,” SAE International Journal of Engines, Vol.1, No.1, pp.115-128, 2009.
- S. Wu, S. Yang, M. Wooldridge and M. Xu, “Experimental Study of the Spray Collapse Process of Multi-hole Gasoline Fuel Injection at Flash Boiling Conditions,” Fuel, Vol.242, pp.109-123, 2019.
- A. Wood, Optical Investigations of the Sprays Generated by Gasoline Multi-hole Injectors Under Novel Operating Conditions, Ph. D. Dissertation, Loughborough University, UK, 2014.
- B. Befrui, G. Corbinelli, M. D’Onofrio and D. Varble, “GDI Multi-Hole Injector Internal Flow and Spray Analysis,” SAE 2011-01-1211, 2011.
- S. Das, S. I. Chang and J. Kirwan, “Spray Pattern Recognition for Multi-hole Gasoline Direct Injectors Using CFD Modeling,” SAE 2009-01-1488, 2009.
- J. Park, K. H. Lee and S. Park, “Comprehensive Spray Characteristics of Water in Port Fuel Injection Injector,” Energies, Vol.13, No.2, p.396, 2020.

