Correlation Analysis among Engine Room Components for Improving the Cooling Performance of Gasoline Vehicles
Copyright Ⓒ 2017 KSAE
Abstract
Vehicles have been developed in accordance with various demands for capabilities and features such as high performance and high efficiency. Consequently, the number and volume of engine parts being manufactured in order to achieve high performance and high efficiency are on the rise. These trends have created limited free space in the engine room, making thermal management quite difficult. In addition, undercover mounting disturbs heat dissipation. Thermal management has recently become a very important issue with respect to vehicle development. In this paper, heat dissipation performance according to the various deformations of some parts in the engine room was numerically analyzed for the purpose of heat damage reduction. Results showed that the coolant inlet temperature of the model with advanced FEM air guide and undercover is 8.3 °C lower than that of the base model.
Keywords:
Engine room, Radiator, Front End Module(FEM), Undercover, Air guide, Cowl, Computational Fluid Dynamics(CFD)1. Introduction
Automobile manufacturers around the world are gradually downsizing engine room to meet the requirements of light weight, fuel efficiency, and pedestrian regulations. On contrary, engineers are adding new components to develop high-efficiency automobiles, which require the techniques for the advanced engine room design. It allows putting the diverse and complex new systems into a smaller engine room space.1) Furthermore, it is important to understand and to analyze the relationships among components when they are integrated in a system. Because these relationships could lead engine or vehicle to face the unexpected problems, even if there is no performance problem as tested in each unit component.2)
In this study, the relationships among the engine room components were analyzed to improve the engine room cooling performance. Various ideas have been applied to cool the engine and to prevent the heat damage of components around the exhaust system. For instance, installing an FEM(Front End Module) air guide or transforming the undercover or cowl had been tested to understand the effect of each part on the heat dissipation of the engine room. In addition, the relationships among these ideas were analyzed. Thermal flow analysis of the engine room can be helpful to design more efficient space in a small engine room. It can also analyze the relationships of the engine room components. In this study, thermal flow analysis of the engine room was carried out using the commercial application Star-CCM+ of CD Adapco. From this analysis, the relationships among the major design factors of the engine room and its performance were analyzed for three main paths. The best correlation was theoretically derived through the analyzed paths.
2. Analysis Method and Conditions
2.1 Analysis Model
The sedan model of a gasoline passenger vehicle was used for this study. The components located in front of the cooling module, such as the front grille and FEM, directly affect the flow rate or direction of the cooling air, and the flow rate and direction of the air can affect the coolant temperature of the radiator. Therefore, the original shape of the model was maintained as much as possible so that the analysis results would not be changed due to the simplification of the analyzed shape.
The main components of the engine room located after the FEM were simplified as much as possible, without affecting the analysis results of the radiator temperature or the temperature around the exhaust system. Some tubes and lines, which are the smallest components located at the rearmost part of the engine room, were completely removed for this analysis.3)
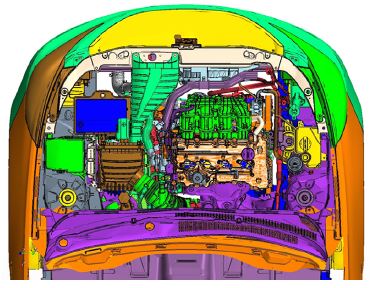
Furthermore, such components as the wheels, which are located outside and would not affect the inside of the engine room, were removed from the analysis model, which contributed to the shortened analysis time and reduced amount of analysis. The actual engine room shape of the analysis model is shown in Fig. 1.
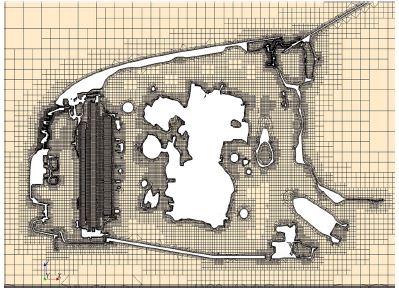
For the basic mesh for the thermal flow analysis around the engine room, the trimmed mesh supported by Star-CCM+ was used. On the wall of the vehicle, the prism layer mesh was used to consider the flow phenomenon by the wall viscosity. As each part has a different effect on the thermal flow of the engine room, the mesh size was determined by considering the importance of each part. A fine mesh was used for such components as the front grille and FEM because the cooling air enters the engine room and directly affects the radiator and other components. A normal mesh was used for the engine and transmission because they have a small effect on the FEM even though they have a thermal effect on the exhaust system. Furthermore, a coarse mesh was used for the components outside the vehicle, which are not related to the flow of the engine room, to reduce the analysis time and cost. Approximately 260 million meshes were used in this analysis, and these are shown in Fig. 2.
2.2 Analysis Method and Conditions
The governing equation for the thermal flow analysis of the engine room is a RANS(Reynolds averaged Navier-Stokes) equation of normal state, incompressible flow, and the k-ε standard wall function model was used for the turbulent flow analysis.4) As it was analyzed as incompressible flow considering the vehicle speed, the constant density condition was used for the air and coolant.
To simulate the heat dissipation characteristics for the radiator of the FEM, the unit part performance characteristic curve was used in a heat exchanger model, and the cooling by the cooling fan was not considered because the vehicle was simulated to run at 160 km/h. The analysis of the condenser and intercooler of the air conditioning system was simplified by considering only the air resistance when the air passes through the condenser and intercooler. The ground effect, which is important for the aerodynamic performance, was not considered because this study was about engine room cooling.5)
For the driving condition in the vehicle thermal flow analysis, the high-speed, high-load operating condition of 160 km/h, which generates a large engine load, was used. The air temperature was 40 °C, and the air pressure was 1 atm. To predict the changes in the internal temperature of the engine room caused by the engine and exhaust system, the engine exhaust heat was simulated simply by artificially applying the temperature condition of 900 °C around the connection between the engine and the exhaust system. The radiant heat of the exhaust system was not considered. For the heat output of the radiator and the coolant flow rate, the values obtained from past experiments were used. The flow of the cooling air was simulated using the porous medium analysis method for each heat exchanger. To analyze the relationships among the engine room components, the coolant temperature at the radiator entrance, and the flow rate and uniformity of the cooling air passing through the radiator, were selected as major performance indices.6,7) In addition, to examine the change in the ambient temperature inside the engine room caused by the heat generated from the engine, the ambient temperature around the exhaust system in the back space of the engine was selected as an object of comparison.8)
3. Results
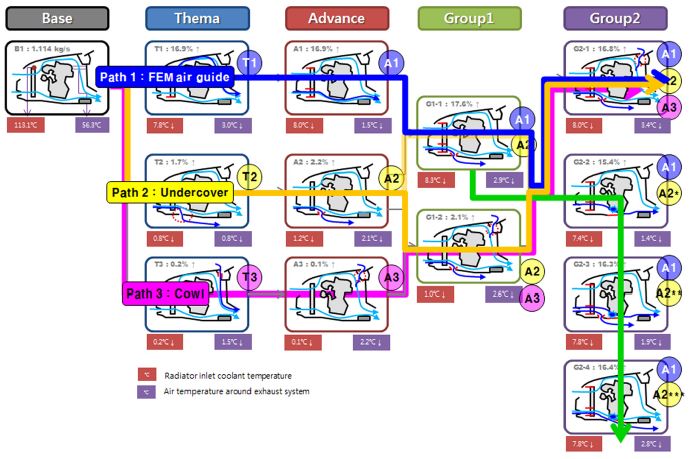
To analyze the relationships among the engine room components for the improvement of the engine room cooling performance, the heat dissipation performance was evaluated for three different themas (T) (i.e., the mounting of the FEM air guide, the improvement of the undercover design, and the addition of a cowl hole) as well as for the base model(Base, B). Later, based on the results of the themas, the heat dissipation performance of the additionally improved model(Advance, A) was evaluated. To analyze the relationships among the components, a complex model(Group1, G1) that combined the thema and the improved models and a model that had additionally improved the complex model(Group2, G2) were added. The method that can theoretically produce the best correlation was derived by creating a performance map and analyzing the path based on the above results. The derived results are shown in Fig. 3.
3.1 Performance Evaluation by Thema
As a result of the analysis of the base model, it was predicted that the coolant temperature at the radiator entrance would be 113.1 °C, that the cooling airflow rate through the radiator would be 1.114 kg/s, and that the ambient temperature of the engine room around the exhaust system would be 56.3 °C.
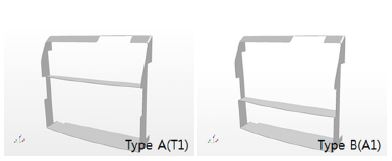
The shape of the FEM air guide is shown in Fig. 4. The FEM air guide is attached to the front part of the FEM. The cooling air that enters the engine room through the front grille must be able to overcome much resistance to pass through the cooling module. Therefore, the cooling air entering the engine room through the front grille has a large tendency to escape by the side of the module because it must be able to overcome much resistance to pass through the cooling module. Mounting the FEM air guide increases the amount of cooling air passing through the cooling module because the escaping flow is guided to pass through the cooling module.
Compared to FEM air guide type A, the location of the center panel in type B was moved by 20 mm towards the bottom of the vehicle. Compared to the base model, the coolant temperature at the radiator entrance decreased by 7.8 °C when FEM air guide type A(9T1) was mounted, and by 8.0 °C when type B(A1) was mounted. The mounting of the FEM air guide decreased the temperature in both models because the coolant flow rate through the cooling module increased. The temperature increase in the A1 model was greater than that in the T1 model because although both models increased the flow rate through the cooling module by 16.9 % over the base model, the flow uniformity increased from 0.749 to 0.753 due to the positional relation between the central guide and the front grille of the FEM air guide. In general, when the flow uniformity increases at the same cooling air flow rate, the cooling performance improves.9)
The engine room ambient temperature around the exhaust system of the T1 model, however, was predicted to be lower by 3 °C compared to the base model, whereas the analysis result of the A1 model was predicted to be lower by 1.5 °C. Thus, the engine room ambient temperature around the exhaust system of the T1 model mounted with FEM air guide type A was lower. This is because the ambient temperature around the exhaust system is near the top of the engine room. The central separation guide of FEM air guide type A for the engine room was moved upward, and the path is narrow. As a result, the maximum flow rate through the top of the engine increased from 10.3 to 10.5 m/s, which is advantageous for improving the ambient temperature of the engine room around the exhaust system.
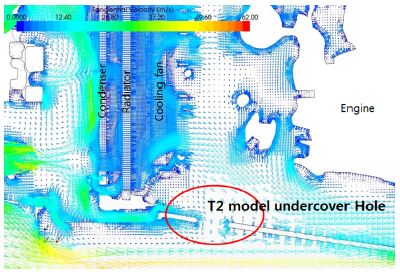
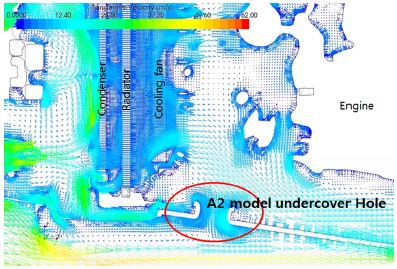
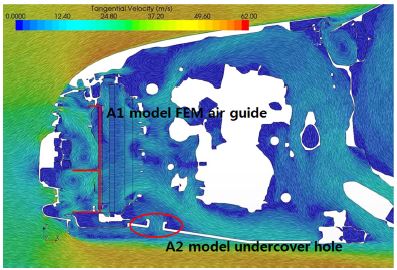
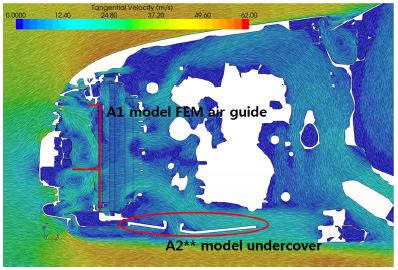
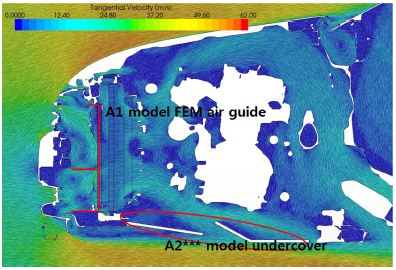
In the analysis of the effect of the undercover design to improve the thermal environment inside the engine room, a hole was drilled on an ordinary undercover, as shown in T2 in Fig. 5, or a chimney-type pipe was created, as shown in A2 in Fig. 6, so that the air passing through the cooling module would escape from the engine room rather than stay inside, and then the analysis results were compared.
As a result of the improvement of the thermal environ ment inside the engine room using an undercover, the coolant temperature at the radiator entrance in the T2 model was predicted to be lower by 0.8 °C compared to the base model, and the temperature in the A2 model was predicted to be lower by 1.2 °C. The A2 model’s structure makes it easier for the air passing through the FEM to escape the engine room. Hence, it is more advantageous for the cooling by the coolant flowing in the radiator because the circulation of air around the FEM is easier than in the T2 model. Furthermore, the engine room ambient temperatures around the exhaust system of the T2 and A2 models were predicted to be lower by 0.8 and 2.1 °C, respectively, compared to the base model. It seems that the flow passing through the bottom of the engine and escaping to the back of the engine room decreased due to the flow escaping through the undercover hole, and this decreased the collision with the flow passing through the top of the engine, thus lowering the resistance, which is advantageous for cooling the area surrounding the exhaust system.
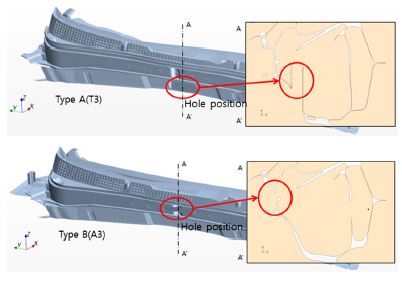
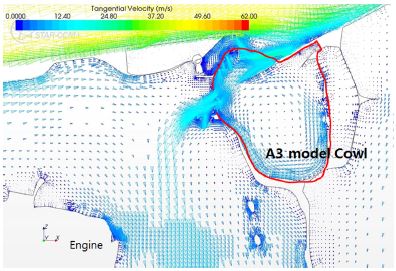
The model with a hole added to the cowl is shown in Fig. 7. The analysis result of the cowl-improved model revealed that when type A(T3), whose pipe-type flow path is directed to the bottom of the vehicle, was used, the engine room ambient temperature around the exhaust system was predicted to be lower by 1.5 °C compared to the base model, and when type B(A3) was used, it was lower by 2.2 °C compared to the base model.
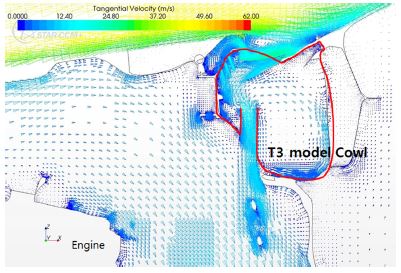
Basically, it is impossible to create a large hole in the cowl because the cowl protects the components of the engine room from rainwater, etc. Therefore, even if a hole is created in the cowl, as the cooling air volume is much smaller than the flow coming to the surroundings of the engine after passing through the radiator grille at the front part of the vehicle, the flow path can be dependent on the flow that passes through the radiator grille. The flow coming through the cowl hole of the T3 model immediately escapes to the bottom of the engine room, as shown in Fig. 8, and the A3 model, whose cowl hole is directed towards the top of the engine, is in a better position to influence the cooling of the engine room compared to the T3 model, as shown in Fig. 9. As a result, the T3 model has a lower effect of reducing the engine room ambient temperature around the exhaust system compared to the A3 model.
The coolant temperature at the radiator entrance of the T3 and A3 models was predicted to be lower by 0.2 and 0.1 °C, respectively, compared to the base model, which was not much helpful for cooling the radiator at the front of the engine room.
3.2 Analysis of the Correlations among the Engine Room Components
To improve the heat damage of the engine room, the performance improvement of multiple components was carried out simultaneously, and the correlations among the improved components and the effects of the components’ correlations on the performance of the component modules were examined.
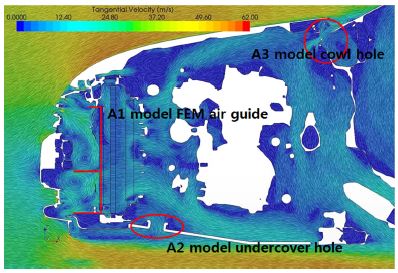
First, the G1-1 model is shown in Fig. 10. It is a combination of the model with an improved FEM air guide(A1) and the model with an improved undercover hole(A2) for maximizing the performance of the FEM. With this model, it was predicted that the coolant temperature at the radiator entrance would be lower by 8.3 °C compared to the base model, and that the engine room ambient temperature around the exhaust system would be lower by 2.9 °C compared to the base model.
Both the coolant temperature at the radiator entrance and the engine room ambient temperature around the exhaust system showed better performance compared to the cases where a single component was changed. This result suggested that the combination of two components can have a better effect on the performance of the FEM.
As another method, the G1-2 model, which is a combination of the improved undercover hole model (A2) and the improved cowl hole model(A3), was analyzed. The improvement of the undercover design aims to improve the FEM performance, and the improvement of the cowl hole aims to reduce the temperature of the exhaust system and the engine room ambient temperature around the exhaust system. These two models were combined to improve both the radiator coolant temperature and the engine room ambient temperature around the exhaust system. The analysis results showed that the coolant temperature at the radiator entrance was predicted to be lower by 1.0 °C compared to the base model, and the engine room ambient temperature around the exhaust system was predicted to be lower by 2.6 °.
When A2 and A3 were applied simultaneously, however, the coolant temperature at the radiator entrance was higher by 0.2 °C compared to the A2 model with an improved undercover hole, suggesting a decreased cooling performance of the FEM. The engine room ambient temperature around the exhaust system was lower by 0.4 °C, however, compared to the result of the application only of the cowl hole. Therefore, it was effective when the A2 and A3 models were applied simultaneously.
With the G2-1 model in Fig. 11, which is a combination of the improved FEM air guide model(A1), the improved undercover hole model(A2), and the improved cowl hole model(A3), the coolant temperature at the radiator entrance was predicted to be lower by 8.0 °C compared to the base model, and the engine room ambient temperature around the exhaust system was predicted to be lower by 3.4 °C. The G2-1 model was more effective in lowering the engine room ambient temperature around the exhaust system than the G1-1 model, but it increased the coolant temperature at the radiator entrance. Thus, the application of a cowl showed a bad effect when only the FEM was considered.
The reason for the foregoing can be explained by the effect of the cowl hole. The hole in the cowl can improve the engine room ambient temperature around the exhaust system because the external cooling air can enter the engine room. The cooling air, however, collides with the flow that comes to the back of the engine room through the radiator grille at the front of the vehicle and the top of the engine, which generates flow resistance and decreases the flow passing through the cooling module. In fact, when the flow rate through the cooling module was measured in this study, it was found that the flow rate through the cooling module when there was a hole in the cowl decreased by 0.8 % compared to when there was no hole in the cowl.
Thus, when the components that showed performance improvement independently were combined into a module, the performance improved or decreased depending on the correlations among the components rather than showing the sum of the individual performances.
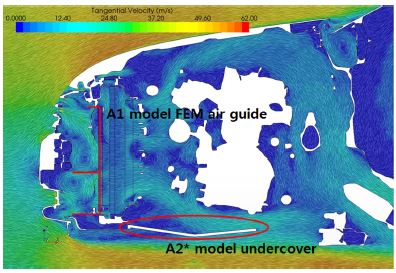
Additional analysis was performed with the G1-1 model, which had shown the best performance. The FEM air guide, which by itself already contributed greatly to the performance improvement, was no longer changed, and the shape of the undercover was further changed. The shapes of the undercover sections are shown in Fig. 12, 13, and 14. The analysis results revealed that both the coolant temperature at the radiator entrance and the engine room ambient temperature around the exhaust system of the G2-2, G2-3 and G2-4 models were higher than those of the G1-1 model.
The reason for the high cooling efficiency of the G1-1 model was believed to be the fact that the heated air passing through the FEM air guide and the cooling module could easily escape through the undercover hole. Therefore, the G2-2 to G2-4 models were designed in such a way that the air passing through the FEM could escape from the engine room more easily. This concept, however, resulted in a decreased space between the engine and the undercover, which interfered with the flow escaping to the back of the engine and decreased the flow rate of the cooling air passing through the radiator. As a result, the cooling performance of the FEM decreased.
As shown in the analysis results of this study outlined in Table 1, the G1-1 model, which is a combination of the A1 and A2 models, showed the best result with regard to the temperature at the radiator entrance, and the G2-1 model showed the best result with regard to the engine room ambient temperature around the exhaust system.
4. Conclusions
A numerical analysis study on the engine room was conducted using thermal flow analysis techniques. The coolant temperature at the radiator entrance and the engine room ambient temperature were predicted according to the application of each component, and measures to improve the thermal environment inside the engine room were derived according to the correlations among the engine room components.
Below are the conclusions that were arrived at.
- 1) The cooling performance of the FEM can be improved by installing a FEM air guide, which will greatly increase the flow passing through the cooling module.
- 2) Creating a hole in the undercover is expected to generate aerodynamic resistance, but the heated air passing through the FEM can be discharged directly, without passing through the engine, which will decrease the engine room residence time of the heated air. This will decrease the engine room ambient temperature.
- 3) Creating a hole in the cowl will not decrease the coolant temperature at the radiator entrance, but it will decrease the temperature around the exhaust system because the cooling air will flow directly to the surroundings of the exhaust system.
- 4) To analyze the correlations among the engine room components, the FEM air guide, undercover, and cowl components were combined and analyzed. The analysis done by applying the components individually or all together revealed that the case of combining the FEM air guide and the undercover hole showed the best result.
- 5) The analysis results revealed that the FEM air guide and the undercover hole were mutually complementary, but the addition of a cowl hole had a negative effect on lowering the coolant temperature at the radiator entrance due to the collision between the flows.
- 6) Understanding the correlations among the components of the modules through the modularization of the said components can contribute to improved performance through the improvement of such correlations.
References
- G. S. Lee, H. S. Hoe, J. P. Won, J. C. Kim, and D. H. Kwon, “Cooling Performance Evaluation to the Front End Module by Means of Underhood Simulation”, KSAE Fall Conference Proceedings, p1217-1223, (2007).
- S. J. Baek, and M. S. Kim, “Influence of an Engine Room Undercover on Aerodynamic Forces”, KSAE Fall Conference Proceedings, p584-589, (2006).
-
K. S. Song, S. O. Kang, H. I. Park, J. D. Kee, H. H. Kim, and D. H. Lee, “Study on the Influence of Wheel Arches, Wheels, and Side Mirrors on Aerodynamic Performance of a Fast Cruising Passenger Car”, Transactions of KSAE, Vol.20(No.5), p26-35, (2012).
[https://doi.org/10.7467/ksae.2012.20.5.026]

-
K. Kawaguchi, M. Hashiguchi, R. Yamasaki, and K. Kuwahara, “Computational Study of the Aerodynamic Behavior of a Three-Dimensional Car Configuration”, SAE International Congress and Exposition, (1989).
[https://doi.org/10.4271/890598]

- S. W. Lee, J. H. Park, E. S. Ji, and B. G. Ahn, “Influence of Engine Undercover to Vehicle Aero/Thermal Performance”, KSAE Annual Conference Proceedings, p1909-1916, (2012).
- C. H. Shin, S. H. Lee, W. G. Park, and G. L. Jang, “The Study about the Performance-Analysis of a Automotive Engine Cooling System”, Transactions of KSAE, Vol.14(No.2), p39-48, (2006).
- J. S. Maeng, J. Y. Youn, and H. G. Son, “Reengineering of Bus Engine Room Structure for Preventing Thermal Damages”, Transactions of KSAE, Vol.8(No.3), p46-55, (2000).
- K. T. Oh, J. H. Kim, S. W. Lee, Y. S. Kim, J. W. Ha, and W. K. Kang, “Automobile Under hood Thermal and Air Flow Simulation Using CFD”, Journal of KSCFE, Vol.12(No.1), p22-27, (2007).
- D. I. Jeon, G. Y. Lee, I. G. Hwang, and S. S. Park, “Exhaust Flow Distribution and Uniformity using Simulated Dynamic Exhaust Flow Bench and Hot-wire Anemometer”, KSME Conference, p73-78, (2008).
