System-Level Simulation of Active Cooling Control in an Automotive Engine through the Application of Electronically-map-controlled Thermostat
Copyright Ⓒ 2017 KSAE
Abstract
Advanced engine cooling systems reflect a variable coolant temperature because they can decrease the hydrodynamic frictional losses of lubricated engine parts in light duty conditions. To raise the operating temperature of passenger cars to a constant level safely, and thus optimize combustion and all accompanying factors, a new thermostat technology was developed: the electronic, map-controlled thermostat. The introduction of an electronically controlled thermostat would require mathematical models and real-time algorithms to implement intelligent thermal control strategies for prescribed engine temperature map tracking. In this paper, the feasibility of controlling the coolant temperature was examined in different driver demand conditions by using the electronic, map-controlled thermostat in lieu of a conventional, wax-based thermostat. FTP-75 and highway cycles were tested on a passenger car with a 1.5 liter, 4-cylinder diesel engine from CRUISEⓇ M software, which is based on a physical, mathematical approach to model vehicle dynamics, transient engine performance, and an engine thermal management system. The engine operation conditions and engine temperature in corresponding cycles have been computed and used as an input to the Matlab SimulinkⓇ control model where the target coolant temperature is calculated, based on a map of optimized coolant temperature.
Keywords:
Engine thermal management system, Electronically-map-controlled thermostat, Coolant temperature map, Hydrodynamic frictional loss, Engine coolant temperature control logic, System-level simulation1. Introduction
The improvement of the thermal efficiency of the engine is essential for improving the fuel efficiency of vehicles. In particular, the thermal efficiency of the engine during cold start can be greatly improved by optimizing the thermal management system.1) The latest engine thermal management system operates at the optimum operating temperature according to the operating conditions to reduce the heat and friction losses, which can guarantee the optimum volume efficiency, combustion stability, and safety margin for the durability of the mechanical elements. Based on the previous studies,1,2) in the case of the gasoline direct injection(GDI) engine, the optimum coolant temperature is 115 °C when the load is 3/4 or lower, and 100 °C when it is over 3/4, which is closely related to the optimum viscosity of lubricant. Recently, Toyota applied a cooling technology that can optimize the viscosity of lubricant according to the operation conditions to the DI diesel engine for EURO-5, and achieved a 9.79 % fuel cost reduction.3)
In the case of gasoline engines, the TGDI(Turbocharged gasoline direct injection) engine is mainly produced. This engine has excellent fuel efficiency due to its high output density and large sweet spot, but knocking in the mid- to high load domain at a low speed and at LSPI(Low-speed pre-ignition) are serious problems.4) Thus, many techniques, such as cooledexhaust gas recirculation(EGR) and split cooling, are being proposed and developed to address these problems.5) Therefore, accurate coolant temperature control under mid- to high loads and during rapid acceleration and deceleration, and the development of a water temperature controller with a fast response, have been actively carried out of late. To achieve this goal, domestic and international car manufacturers are actively using the electronically-map-controlled thermostat, which allows the electronic control unit(ECU) to control the coolant temperature according to the operation conditions, for cooling control.6,7) In the final analysis, the purpose of the development of the electronically-map-controlled thermostat is to maintain the temperature of the operating engine at the optimum level according to the operation conditions, so as to improve the fuel efficiency under a partial load, reduce the exhaust gas emissions, and improve the output and suppress knocking during rapid acceleration and highload driving. The performance of the electronicallymap-controlled thermostat is highly dependent on the control algorithm that efficiently traces the abnormal target coolant temperature according to each operation condition. Therefore, an accurate optimum coolant map according to the revolutions and load of the engine is required. To date, a variety of coolant control algorithms, such as the PID controller, reverse technique, and neural network controller, have been developed to control(based on the map) the difference between the engine coolant exit temperature and the target temperature, using programs like AMESimⓇ and Matlab Simulink®.8-10) The performance of these algorithms was evaluated mainly using a one-dimensional circuit diagram that thermodynamically modeled the thermal management system, and the target value tracking performance of the algorithms was evaluated by connecting the engine gas dynamic model using a dimensionless heat generation model with an engine thermal management model.11,12)
To more completely evaluate the control algorithm of the electronically-map-controlled thermostat, however, an analysis at the vehicle system level is necessary. Therefore, in this study, a system-level analysis model was developed to analyze the cooling circuit, the lubrication circuit, the engine and vehicle dynamics model, and the ECU and cooling control model in an integrated manner. Then a control algorithm for operating the electronically-map-controlled thermostat was analytically implemented in the FTP-75 and highway fuel economy test(HWFET) modes, and the performance of this algorithm was evaluated. Furthermore, the electronically-map-controlled thermostat was comparatively evaluated with the conventional wax-based thermostat in the aforementioned test mode to determine the effect of the electronically-map-controlled thermostat on the fuel efficiency of vehicles.
2. System-Level Analysis Model
2.1 Coolant and Lubricant Channel Analysis Model
For the optimum design of the thermal management system of vehicles, such as the coolant temperature, the development of a numerical model is required, which can analyze the driving system, the engine performance, the heat transfer in the engine block, the intake and exhaust channels of the engine, the engine thermal management system, and the electronic control in an integrated manner. In this study, a vehicle-level analysis model for a vehicle equipped with a 1.5-liter diesel turbo-CRDI engine was constructed using CRUISE® M15) developed by AVL.
The cooling and lubrication circuits were considered incompressible one-dimensional non-isothermal flows, and the fluid flow was assumed to be quasi-static. Hence, the continuous and momentum equations at each node of the circuit are as follows:
| (1) |
| (2) |
where m is the mass flow rate, t the time, A the sectional area, P the pressure, and i the number of pipes connected to the node. The pressure drop that occurs when the coolant and lubricant pass through the components of each cooling and lubrication channel was determined using various empirical formulas.13-15)
The energy conservation equation at each node is as follows:
| (3) |
where h is enthalpy and i and j are the numbers of inlets and outlets, respectively. The working fluid in each circuit and the heat transfer coefficient in each component were determined using various empirical formulas13-15) or data obtained experimentally.
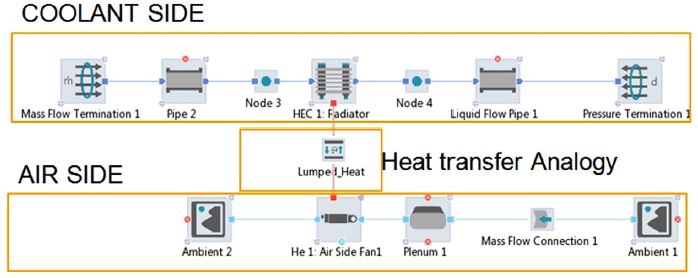
The component that has the greatest effect on the cooling and lubrication performance is the heat exchanger, such as the radiator. For the pressure drop of this component, the Reynolds analogy equation15) was used after correction from the flow rate and pressure drop data obtained from the experiments. Furthermore, the airspace heat transfer between the coolant and a fluid outside the cooling pipe was calculated by correcting the coefficient of the heat transfer correlation equation for each fluid after the flow rates, incoming temperatures, and heat transfer amounts of the two fluids that flow in were experimentally determined. Fig. 1 schematically shows the radiator modeled with CRUISEⓇ M.
For modeling, the coolant channel and external air channel were separately modeled. For the heat transfer coefficient of each channel, the Nusselt and Reynolds similarity equations were used separately. The principle and modeling technique of the electronically-map-controlled thermostat are presented in detail in the references.7,14,18)
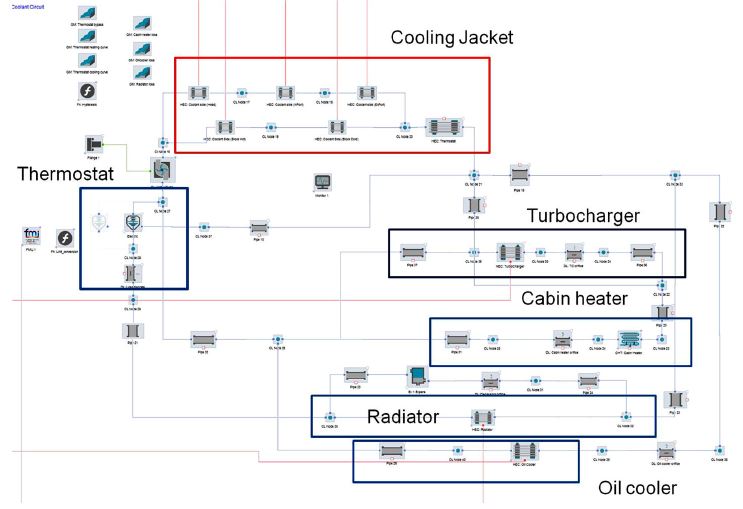
Fig. 2 shows the total coolant circuit diagram and each area that was modeled in this study. As shown in this figure, the channels inside the cylinder block, the supercharger cooling channel inside the exhaust pipe, the channel and radiator passing through the heater core inside the passenger compartment, the oil cooler, and the thermostat are modeled in detail.
2.2 Engine and Intake/Exhaust Flow Analysis Model
The filling and emptying model13,15,16) was used for the flow in the intake and exhaust pipes of the engine in this study, and the Wiebe function13,15,16) was used for the engine combustion. For the heat transfer in the combustion chamber head, piston, and liner, the Woschni 90 model15) was applied. The fuel injection rate was determined based on the map, and for the injection pattern, the experimentally obtained heat generation rate diagram was applied as a map for the engine speed and load. The target EGR concentration according to the operation conditions was determined based on the experimentally obtained map, and was controlled with a proportional-integral-derivative(PID) controller. Table 1 lists the specifications of the engine and vehicle that were used in this study.
The calorific value calculated from this engine model is linked with the cylinder block model, which has been modeled through the lumped capacitance method,14,15) and this model is linked with the cooling and lubrication circuits. Refer to the references13,14) for further details about the analysis method.
2.3 ECU Design
Various open- and closed-circuit controls were used to operate the engine, cooling system, driving system, and vehicle in an abnormal section. The ECU model that was used in this study includes an idle controller for controlling the air-fuel ratio depending on the coolant temperature and ambient situation during idling.
The control algorithm created with SimulinkⓇ was converted to an FMU(Functional mockup unit) by compiling it with AVL ARTE. Lab4Ⓡ for connection with CRUISEⓇ M. Visual Studio 2010Ⓡ was used for the compiler.
2.4 Vehicle and Driving System Models
With the vehicle model, the aerodynamic characteristics and longitudinal vehicle dynamics were analyzed. The mechanical driving system model consists of a library consisting of a gearbox, transmission, clutch, tires, and brakes.13-15)
2.5 Map Control of Electronic Thermostat
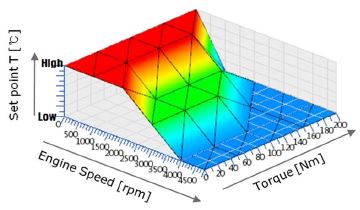
To control the electronic thermostat, the target coolant temperature according to the engine operation conditions must be accurately determined and prepared as a map. In this study, a target coolant temperature map was created by setting the coolant temperature at which the lubricant temperature was maintained at 95~100 °C and the brake-specific fuel consumption(BSFC) was the lowest at each operation condition, through an engine dynamo experiment, as shown in Fig. 3.
To control the electronic thermostat, an algorithm with a fast response is essential for maintaining the optimum coolant temperature according to the engine operation condition. Fig. 4 shows the schematic diagrams of the algorithm for the optimal control of the electronically-map-controlled thermostat developed in this study, created with Matlab Simulink®. As shown in Fig. 4(a), the control algorithm reads the target coolant temperature for the current operation condition from the target coolant temperature map, and calculates its difference with the current coolant temperature at the engine outlet. The PID controller for this control, shown in Fig. 4(b), can optimize the proportional and integral parameters for the total vehicle system level by connecting them with CRUISEⓇ M. As shown in Fig. 4(c), this algorithm modifies the opening area of the thermostat that has been inputted in three steps, depending on the difference between the target and current coolant temperatures of the engine.
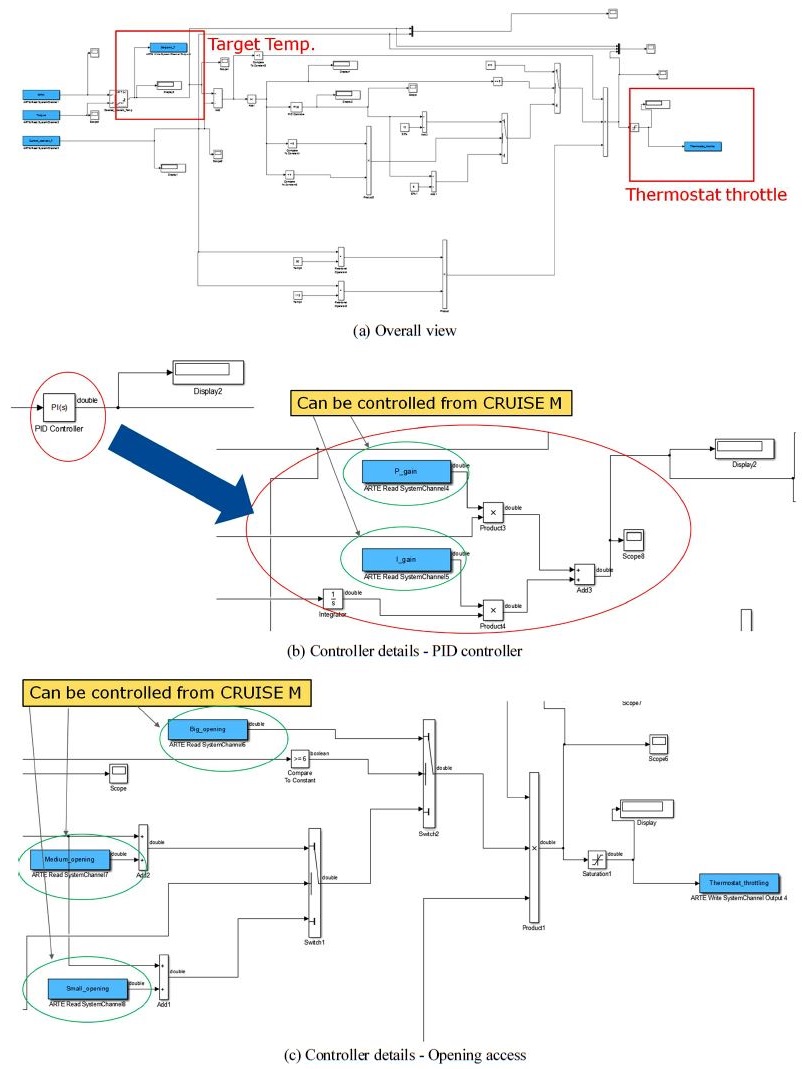
Overall active cooling system control strategy based on the electronically-map-controlled thermostat control algorithm, which can be optimized at the vehicle level using the electronically-map-controlled thermostat in the early engine design stage
This control algorithm is compiled and converted to FMU and linked with CRUISEⓇ M. Thus, the controller tuning can be performed at the vehicle level in virtual reality. Therefore, the optimization design period of the active cooling system can be drastically minimized using the system-level analysis model developed in this study.
3. Analysis Results
In this study, an analysis model that can control the cooling system optimally at the vehicle system level was developed and was numerically analyzed by applying an electronically-map-controlled thermostat to the cooling system of a 1.5-liter diesel engine equipped with a conventional wax-based thermostat. A mapbased control algorithm was developed to operate this electronic thermostat. This model was separately applied to the FTP-75 and HWFET driving modes to predict the tracking performance of the algorithm and the improvement of the fuel efficiency compared to the conventional wax-based thermostat.
3.1 FTP-75 Driving Mode
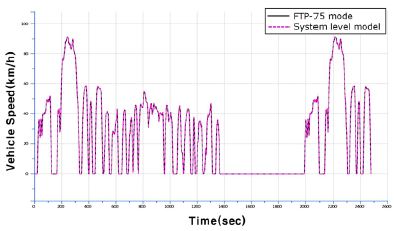
To analyze the fuel efficiency effect of the active cooling system to which an electronically-map-controlled thermostat was applied, a system-level analysis was performed in the FTP-75 mode. Fig. 5 shows a comparison of the vehicle speed specified in the FTP-75 mode and the speed calculated by the vehicle and driving system model in this study. This shows that the model in this study has a very excellent tracking performance. In the case of the FTP-75 mode, the overall load is not high, but it often operates under midto high loads during acceleration.
Fig. 6 shows the temperature changes at the coolant outlet of the engine operating during the FTP-75 mode driving in the case of the conventional wax-based thermostat and the electronically-map-controlled thermostat of this study. The wax-based thermostat shows the distribution of a constant temperature slightly above 80 °C, which is the opening temperature. On the other hand, the map-controlled thermostat tracks the optimum temperature according to each operation condition, and shows a 10 °C or higher coolant temperature amplitude. In particular, the FTP-75 mode shows frequent operations with a distribution of mid- to low loads, indicating that the coolant temperature is generally up-regulated.
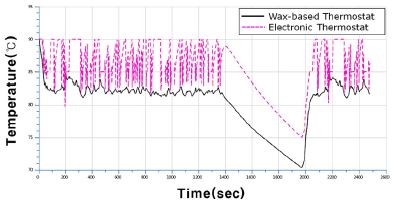
Comparison of the coolant temperatures in the conventional wax-based and map-controlled thermostat systems
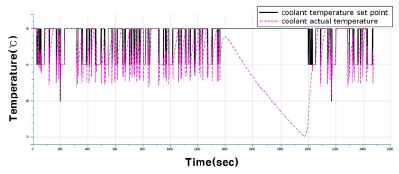
Fig. 7 shows a comparison of the target coolant temperature changes during the FTP-75 mode driving and the actual temperature changes at the coolant outlet of the engine.
The actual coolant temperature tracks the target value well, but a large undershoot compared to the target value appears when the coolant temperature drops under mid- to high loads during rapid acceleration. The cause of this may be the incomplete tuning of the PID controller included in the control algorithm. Another cause of undershoot during the coolant temperature control is the temperature transport delays due to the thermal inertia of the working fluid passing through the thermostat or radiator.
3.2 HWFET Driving Mode
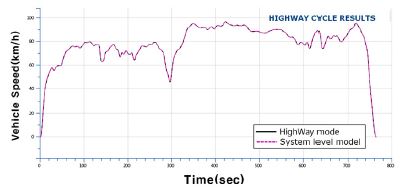
The HWFET driving mode mostly belongs to the operation domain under mid- to low loads and has smaller variations in vehicle speed and load compared to the FTP-75 mode. Fig. 8 shows the tracking performance of the HWFET driving mode of the model developed in this study. As can be seen from the results, the driving mode is tracked very accurately.
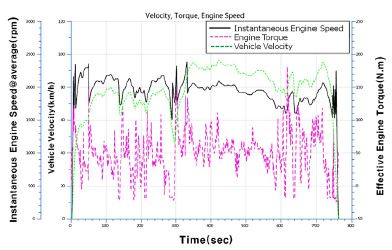
Fig. 9 shows the calculated values of the engine torque and speed and the driving speed of the vehicle in the HWFET driving mode. As shown in the results, this mode has difficulty up-regulating the coolant temperature because the acceleration and deceleration of the vehicle speed are small, there is cruising, and the engine speed, which is a decisive factor of the coolant temperature, remains high for a long time.
Fig. 10 shows the coolant temperature changes at the engine coolant outlet, when the conventional wax-based and map-controlled thermostats were mounted in the HWFET mode.
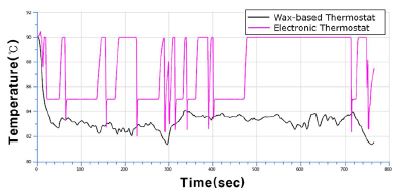
Comparison of the coolant temperatures of the conventional wax-based and map-controlled thermostat systems
As can be seen from the results, the down-regulated sections of the coolant temperature greatly increased compared to Fig. 6, which shows the FTP-75 mode. In the case of this study, there were seven down-regulated sections. Thus, in the HWFET driving mode, it can be predicted that the up-regulation of the coolant temperature will have an insignificant effect on the fuel efficiency.
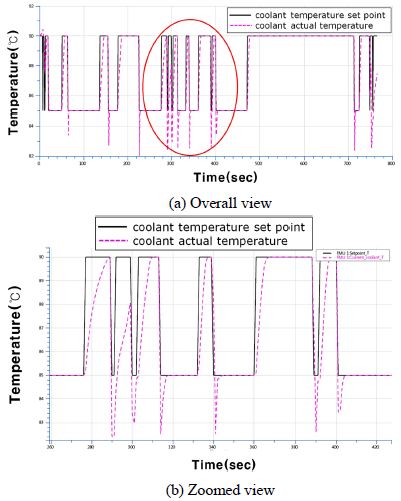
Fig. 11 shows a comparison of the target coolant temperature and the actual coolant temperature at the engine coolant outlet in the HWFET driving mode. As can be seen in Fig. 11(a), the overall tracking performance of the control algorithm was satisfactory, but a large undershoot was observed during the decline of the coolant temperature, as shown in Fig. 11(b), which is an enlarged image of the red circle, where the target coolant temperature frequently changed. The reason for this is that the PID controller was not optimized, as described above. The overshoots or undershoots can be minimized if the proportional and integral parameters will be more precisely tuned. To verify the tracking performance of the control algorithm of the electronically-map-controlled thermostat, the fluid transport delays should be noted. As shown in Fig. 11(b), the time for rising by approximately 5 °C from the lowtemperature area to the up target value was delayed by approximately 5-10 seconds. This was a very small delay compared to the results of a previous study.17) After replacing the wax-based thermostat with a coolant temperature control valve, Ribeiro et al.17) reported a delay of 50 seconds for the increase of the coolant temperature at 10 °C.
This transport delay can be suppressed by minimizing the flow rate of the working fluid through the coolant circuit through the optimization of the radiator capacity and the pipe volume.
Table 2 shows the fuel efficiency gain of a vehicle equipped with an electronically-map-controlled thermostat as a percentage compared to the case of the conventional wax-based thermostat in the FTP-75 and HWFET driving modes.
The coolant up-regulation effect showed a larger fuel efficiency gain in the FTP-75 mode, which has many operation areas of the mid- to large loads, than in the HWFET mode with a cruising area. In the present study, the maximum fuel efficiency gain was obtained in the FTP-75 mode, which was 0.37 %.
In the future, the tracking performance will be further improved through the more precise tuning of the PID controller of the map control algorithm developed in this study, and the fuel efficiency gain effect will be verified in various modes.
4. Conclusion
In this study, a system-level analysis model for the optimum design of a thermal management system was developed to analyze the vehicle driving system, engine performance, heat transfer in the engine block, intake and exhaust channels of the engine, engine thermal management system, and electronic control in an integrated manner.
A control algorithm for the optimal operation of the electronically-map-controlled thermostat was developed and was verified in the FTP-75 and HWFET test modes by being connected with the system-level analysis model.
The verification results confirmed that the coolant temperature in the engine tracked the target value well. Undershoot occurred, however, during the decline of the cooling temperature, and 5- to 10-second delays occurred, raising the coolant temperature by 5 °C. In the future, the undershoot and delays can be minimized through the more precise tuning of the PID controller and by applying the optimized cooling channel.
The application of the system-level analysis model and the control model developed in this study will drastically reduce the design time and cost because the cooling system and various cooling control algorithms can be verified and optimized at the vehicle level during the early stage of design.
Acknowledgments
This study was carried out as part of the technologyinnovation-type SME researcher support project and the WC 300 project of the Ministry of Trade, Industry, and Energy under the assistance of INZI CONTROLS Co., Ltd. The authors would like to express their deep gratitude to all the concerned people.
References
-
J. Lahuerta, and S. Samuel, “Numerical Simulation of Warm-Up Characteristics and Thermal Management of a GDI Engine”, SAE 2013-01-0870, (2013).
[https://doi.org/10.4271/2013-01-0870]

-
H. Couëtouse, and D. Gentile, “Cooling System Control in Automotive Engines”, SAE 920788, (1992).
[https://doi.org/10.4271/920788]

-
J. Chisaki, K. Yoshijima, T. Kikuchi, S. Morinaka, K. Yamada, M. Okamoto, T. Oda, and K. Manabe, “Development of a New 2.0-Liter Fuel-Efficient Diesel Engine”, SAE 2013-01-0310, (2013).
[https://doi.org/10.4271/2013-01-0310]

-
X. Luo, H. Teng, T. Hu, R. Miao, and L. Cao, “An Experimental Investigation on Low Speed Pre-Ignition in a Highly Boosted Gasoline Direct Injection Engine”, SAE 2015-01-0758, (2015).
[https://doi.org/10.4271/2015-01-0758]

-
L. Teodosio, V. De Bellis, and F. Bozza, “Fuel Economy Improvement and Knock Tendency Reduction of a Downsized Turbocharged Engine at Full Load Operations through a Low-Pressure EGR System”, SAE 2015-01-1244, (2015).
[https://doi.org/10.4271/2015-01-1244]

- Mahle Aftermarket Inc, http://www.mahle-aftermarket.com/media/local-media-north-america/pdfs/catalogs-and-literature/mo-2-1013.pdf (2015).
- S. Kim, Y. Kim, H. Joung, W. Jeon, J. Jeong, and S. Jeong, “Application of Graphene Platelets on Electronic Controlled Thermostat of TGDI Engine for Improving Thermal Sensitivity”, Transactions of KSAE, Vol.25(No.1), p66-73, (2017).
-
T. L. McKinley, and A. G. Alleyne, “Real-Time Modeling of Liquid Cooling Networks in Vehicle Thermal Management Systems”, SAE 2008-01-0386, (2008).
[https://doi.org/10.4271/2008-01-0386]

-
J. H. Chastain, and J. R. Wagner, “Advanced Thermal Management for Internal Combustion Engines - Valve Design, Component Testing and Block Redesign”, SAE 2006-01-1232, (2006).
[https://doi.org/10.4271/2006-01-1232]

-
A. Al Tamimi, M. Salah, and A. Al-Jarrah, “Neural Network-based Optimal Control for Advanced Vehicular Thermal Management Systems”, SAE 2011-01-2184, (2011).
[https://doi.org/10.4271/2011-01-2184]

-
M. Khammassi, T. Marimbordes, J. Aubry, B. Barbedette, M. Cormerais, C. Larouci, and Q. Frossard, “A Multi-Physical Model of an Active Thermal Management Valve with Experimental Validation”, SAE 2016-01-0180, (2016).
[https://doi.org/10.4271/2016-01-0180]

-
B. J. Luptowski, O. Arici, J. H. Johnson, and G. G. Parker, “Development of the Enhanced Vehicle and Engine Cooling System Simulation and Application to Active Cooling Control”, SAE 2005-01-0697, (2005).
[https://doi.org/10.4271/2005-01-0697]

-
T. Banjac, J. C. Wurzenberger, and T. Katrasnik, “Assessment of Engine Thermal Management through Advanced System Engineering Modeling”, Advances in Engineering Software, Vol.71, p19-33, (2014).
[https://doi.org/10.1016/j.advengsoft.2014.01.016]

- S. Jeong, S. Kim, G. Lee, J. Jeong, and M. Kim, “Experimental and Numerical Assessment of the Effects of Various Coolant Temperature in Gasoline Vehicle on Fuel Consumption and Emissions”, Transactions of KSAE, Vol.25(No.3), p297-308, (2017).
- Advanced Simulation Technologies, CRUISE M-User's Manual ver. 2015.2, AVL List GmbH, Austria, (2015).
- J. B. Heywood, Internal Combustion Engines Fundamentals, McGraw-Hill, New York, (1988).
-
E. G. Ribeiro, J. L. de C. Meira, and A. P. de A. Filho, “Electric Valve for Coolant Temperature Control(TCV)”, SAE 2007-01-2791, (2007).
[https://doi.org/10.4271/2007-01-2791]

-
G. Liu, Z. Zhao, H. Guan, Y. Liu, C. Zhang, D. Gao, W. Zhou, and J. Knauf, “Influence of Advanced Technology for Thermal Management on SUV”, SAE 2016-01-0238, (2016).
[https://doi.org/10.4271/2016-01-0238]


