
A Study on the Optimization of Flow Around a Wheel Using an Active Air Flap
Copyright Ⓒ 2026 KSAE / 252-06
This is an Open-Access article distributed under the terms of the Creative Commons Attribution Non-Commercial License(http://creativecommons.org/licenses/by-nc/3.0) which permits unrestricted non-commercial use, distribution, and reproduction in any medium provided the original work is properly cited.
Abstract
This study investigates the aerodynamic performance of a Wheel Air Curtain(WAC) system under steering conditions. Measurements from a 67.7 km real-road route indicated that steering angles of 3–10° were the most common during practical driving. CFD analyses were conducted at steering angles of 0°, 15°, and 30° to evaluate the pressure distribution and flow behavior around the tire sidewall and wheel-house region. The results demonstrate that steering motion causes misalignment between the WAC jet and tire surface, thus leading to increased local pressure and turbulence. An Active Air Flap was incorporated into the WAC outlet to improve flow alignment. The proposed system effectively reduced the tire sidewall pressure. The findings suggest that steering-responsive aerodynamic control can enhance WAC effectiveness under practical driving conditions.
Keywords:
Wheel Air Curtain(WAC), Active air flap, Steering angle, Aerodynamic drag, CFD, Electric vehicle1. Introduction
In the automotive industry, aerodynamic performance has become increasingly important for improving fuel and energy efficiency, maintaining high-speed stability, and reducing noise. For electric vehicles (EVs), changes in the drag coefficient (Cd) directly affect driving range, unlike in internal combustion engine vehicles. Therefore, developing technologies that improve aerodynamic efficiency is now a key priority. The area surrounding the front tires and wheel housings accounts for approximately 25–30 % of the total aerodynamic drag, 1-4) prompting automakers to widely adopt Wheel Air Curtain technology to control the airflow in this region.
In general, the Wheel Air Curtain operates by issuing a high-speed jet through an air duct located in the front bumper. By following the outer surface of the front tire, the jet reduces turbulence around the wheel and blocks airflow into the wheel housing, thereby lowering aerodynamic drag. However, most air curtains applied in mass-produced vehicles are developed for straight-line driving conditions (steering angle δ = 0°). Research indicates that steering angle has little effect on air curtain effectiveness at 50 km/h, but it influences performance at highway speeds of 80–120 km/h. The results indicate that current designs do not consider how the relative position of the jet and the tire’s outer surface changes with increasing steering angle. As the steering angle increases, suspension geometry shifts the tire outward relative to the vehicle body, while the orientation of the tire surface’s normal vector changes simultaneously. Under these conditions, a fixed air curtain jet may deviate from the outer surface of the tire, striking the wheel surface at an angle or potentially increasing turbulence within the wheel house.
Although these physical characteristics are known, existing research has mainly optimized fixed air curtains for straight-line driving, while investigations into how steering angle changes affect air curtain performance and into variable Wheel Air Curtains that adjust jet direction and outlet position in response to steering angles remain scarce. International literature has rarely addressed technology that maintains the optimal air curtain as the steering angle changes, while domestic research on this technology remains at an early stage.
To address these issues, this study proposes a variable Wheel Air Curtain concept that adjusts the jet direction or outlet position as the steering angle changes and quantitatively evaluates its aerodynamic performance using Computational Fluid Dynamics (CFD) and reduced-scale wind tunnel experiments.5,6) The study varies the steering angle (δ) within the 0–20° and 30° ranges and compares the variable system against a fixed air curtain to assess changes in drag (C_d), front-axle lift (C_lf), and yaw moment (C_n). This process enables the study to determine why fixed air curtains experience performance degradation and to analyze whether the variable air curtain maintains stable jet-tire interaction throughout the full steering-angle range.
Most previous studies on Wheel Air Curtains examine drag reduction under straight-line driving conditions, but real-world driving causes the tire protrusion and jet impingement location to change continuously as the steering angle varies. Using real-world data, the study analyzes steering angle frequency and examines potential WAC performance degradation caused by steering angle changes through CFD and visualization experiments. A key contribution of this study is the proposed structure, which uses an active air flap to control the WAC discharge direction according to steering conditions.

Specifications of the materials used in the experience
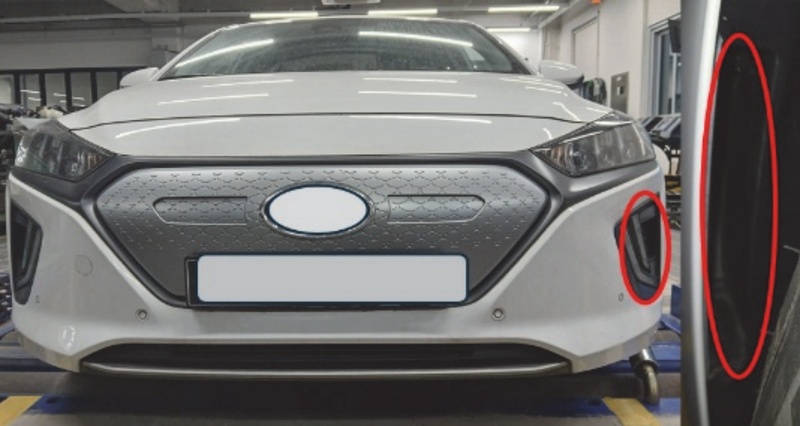
Vehicle used for Wheel Air Curtain experiment
2. Experimental Apparatus and Measurement Method
2.1 Structure of Wheel Air Curtain Experimental Device
We aim to evaluate the performance aspects and effects of the currently applied Wheel Air Curtain and provide direction through experiments on the effects that may occur under non-adjustable driving conditions or when tires protrude beyond the bumper standards due to modifications. Although the Wheel Air Curtain designs vary among the vehicles, this experiment uses a 2019 model EV as the sample vehicle.
2.2 Comparison of Steering Angles According to Road Driving Conditions
General national highways (design speed 60–80 km/h) constructed in accordance with the Road Construction Standard Specification (KSC 440000) of the Ministry of Land, Infrastructure and Transport are designed with R ≈ 150–300 m Expressway main line (100–120 km/h), and R ≈ 1,000 m or more IC ramp (Loop, entrance/exit): R ≈ 40–80 m.
| (1) |
R: plane curve radius (m)
V: design speed (km/h)
e: superelevation (superelevation, unit: m/m, e.g., 0.08 = 8 %)
f: lateral friction coefficient (approximately 0.10 to 0.15)
| (2) |
L: wheelbase (m) – approx. 2.8 m for a mid-size sedan
R: road curve radius (m)
δ: wheel steering angle (degrees, converted to degrees)
Φ≈is⋅δ
Φ: the steering wheel angle that the driver actually turns (°)
δ: front-wheel steering angle (°)
2.3 Steering Angle Required for Road Driving
Using the specifications of the car selected for this study, the wheel steering angle in the interchange (IC) ramp section is estimated at approximately 3.2°. With a steering gear ratio of 15:1, the corresponding steering wheel angle is approximately 48°. Since aerodynamic force has a relatively greater influence on tire air curtain efficiency at high speeds of 80 to 120 km/h, this experiment varies the steering angle from 2° to 20°.
| (3) |
The steering-wheel angle is approximately 50°, thereby corresponding to approximately 1/7-1/8 of a full turn.
| (4) |
The steering-wheel angle is 10~15°.
| (5) |
The steering-wheel angle is less than 10°.
| (6) |
The steering-wheel angle is approximately 4°.
| (7) |
The steering-wheel angle is 2~3°.
2.4 Presentation of Tire Fender Derivation Amount According to Steering Angle and Tire Derivation Amount
Using the formula below to calculate the derivation amount of the front bumper and tires, the front derivation amount was approximately 5 mm at a steering angle of 3°. The actual vehicle measurement also produced a value of 5 mm, which was also derived in this study. For steering angles of 5° to 10°, the experiment used the derived values ranging from 8.7 to 17.5 mm.
| (8) |
2.5 Steering Angles Required for Real-World Driving
This study used a 67.7 km route between Gwangju and Gusipo to quantitatively analyze the distribution of vehicle steering wheel angles under real-world driving conditions. Real-time measurements of the steering wheel angle, vehicle speed, lateral and longitudinal acceleration, and yaw rate were obtained with a Global Diagnostic System (GDS) diagnostic tool. The results indicated distinct differences in steering angles based on road type and driving environment.
Repeated occurrences of minor steering angles in the 3–10° range were observed on high-speed road sections. These angles correspond to routine steering inputs, including maintaining lane position on straightaways, compensating for crosswinds, and making slight lane adjustments during overtaking. Throughout the drive, steering angles within this range occurred 210 times in total, including 78 instances (37.1 %) recorded on high-speed roads. In contrast, the relatively larger steering angles (10–18°) were concentrated in areas with complex road geometry, including national highways, intersections, curves, and IC ramps, where 126 instances were recorded in total.
Among the recorded cases, surface roads and IC ramps accounted for 62 cases (49.2 %), demonstrating clear differences in steering demand based on road characteristics.
Across the 67.7 km route, the vehicle generated 336 steering events in total, indicating that steering-angle magnitude, frequency, and duration vary substantially with the driving environment. The Effective Steering Segment Length, which represents the distance over which the vehicle state changes during a steering maneuver, was set to 15 m, 30 m, and 50 m to quantitatively assess the effects of steering events on vehicle aerodynamics and dynamics. These values were then converted into distance contribution rates.
Cumulative distances influenced by steering events ranged from approximately 5.04 km to 16.8 km, thus corresponding to 7.4 % to 24.8 % of the total driving distance. As shown in Table 2, comparing affected distances calculated under the assumptions for each steering maneuver indicates that 30–50 m is a more realistic range when real-world driving design standards (e.g., curve radius, transition curve length, and ramp length) are considered. Under real-world driving conditions, approximately 15–25 % of the total driving distance can be regarded as segments in which steering maneuvers may alter the vehicle’s aerodynamic characteristics.
Driving distance according to the rotation angle of the steering wheel
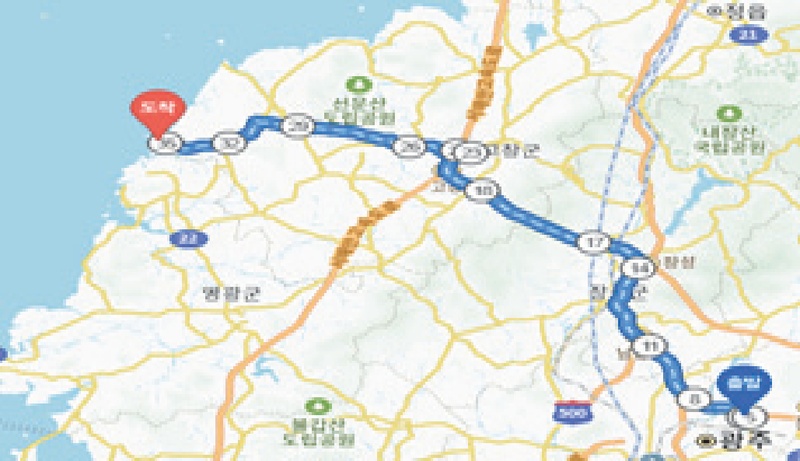
Map of the actual road used in the experiment
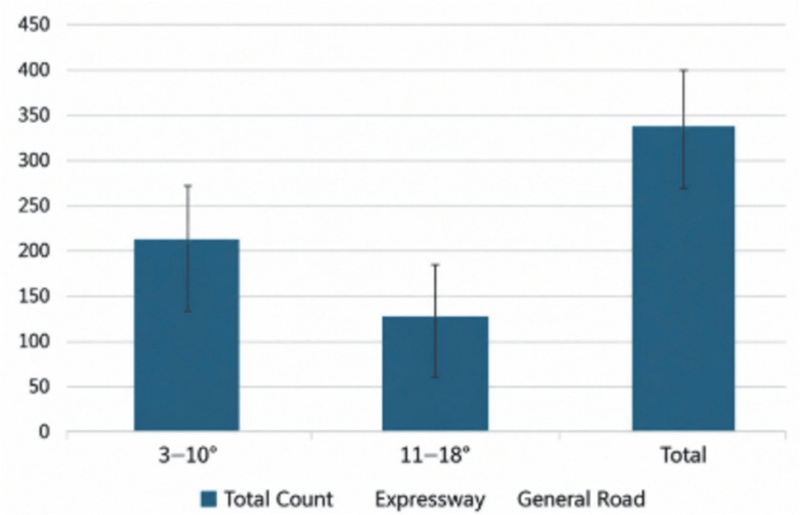
Repeated number of steering wheel angles according to actual driving
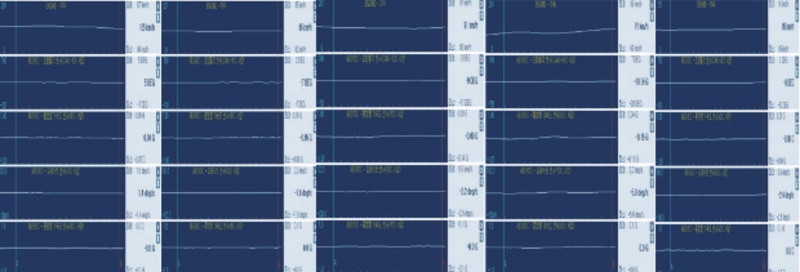
Using a diagnostic device to obtain data on actual vehicle speed and steering wheel during driving
Within these steering segments, the pressure distribution and flow patterns surrounding the Wheel Air Curtain differ from those during straight-line driving. As a result, the air curtain’s effectiveness in reducing turbulence and drag, which was originally designed for straight-line conditions, may be partially reduced or altered. By contrast, the air curtain’s intended aerodynamic benefits are estimated to remain stable over 75–85 % of the driving distance, corresponding to straight-line driving or minor steering adjustments. Although individual driving habits and overtaking sections may have an influence, this study did not consider them as specific variables. The experiment instead treated them as general driver characteristics. The analysis indicates that Wheel Air Curtain performance under real-world driving conditions may vary with steering conditions. This finding suggests the potential use of steering-linked aerodynamic designs or active air management systems (Active Aero) that account for steering states. As shown in Fig. 5, turning the steering wheel by 10° causes the tire to protrude approximately 20 mm beyond the front bumper.
| (9) |
D: steering influence distance (km)
N: Total steering events (336)
de: Effective influence distance per steering event (0.015, 0.03, 0.05 km)
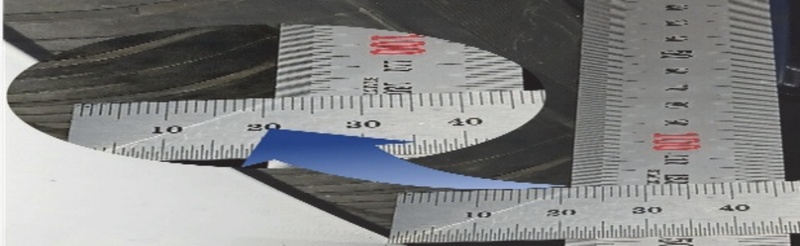
Measurement of the amount derived from the front bumper when the steering wheel angle is 10°
3. Analysis Through Flow Analysis
3.1 Pressure Distribution Experiment Applied to Tires by Wheel Air Curtain Through Flow Analysis
Solid Works Flow Simulation was used to analyze a vehicle operating at high speed, determine the air flow around the wheel, and obtain the air pressure in contact with the tire and wheel at a specified steering angle during driving. For the vehicle implementation, the wheel/tire was analyzed at a rotational speed of 100 km/h.
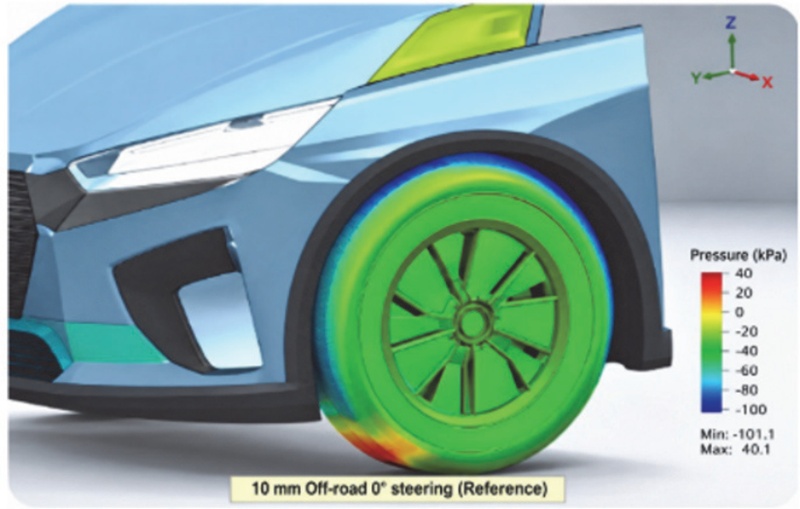
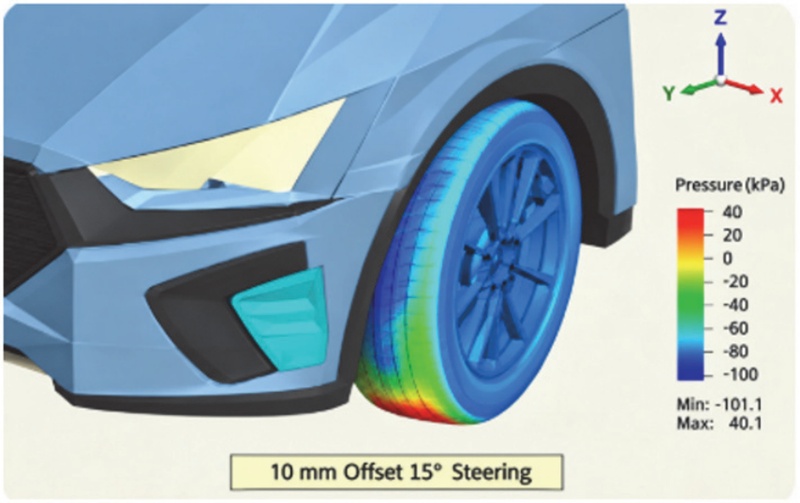
As the steering angle increases, the WAC jet strikes the side of the tire and raises the pressure. The Active Air Flap realigns the jet direction to match the steering angle, thereby alleviating collision with the tire surface and directing the flow outside the fender.
3.2 CFD Analysis Model
SolidWorks Flow Simulation was used for the analysis, while the vehicle model was developed through direct scanning and modeling of the IONIQ EV front end. The boundary conditions included vehicle speeds of 60, 80, and 100 km/h, and iterative analysis was performed for steering angles of 0°, 15°, and 30°.
In this study, analysis of real-world driving data showed that steering angles in the range of 3°–10° occurred most frequently. However, representative steering angles of 0°, 15°, and 30° were selected to evaluate conditions in which aerodynamic effects are more pronounced. Although fine steering between 3–10° occurs repeatedly during real-world driving, steering conditions of 15° and 30° were selected as representative extreme conditions in this study to clarify the flow variation trend of Wheel Air Curtain according to steering conditions.
This is set to represent straight-ahead conditions, intermediate steering conditions, and extreme steering conditions, respectively.
CFD analysis conditions
3.3 Comparison of Tire Pressures on Vehicles Equipped with a Wheel Air Curtain During Straight-Line Driving and at Steering Angles of 15° and 30°
The reliability of the CFD analysis results was assessed by comparing them with the vehicle external flow pressure distribution trend reported in previous studies.7-9)
The visualization experiment and CFD results also demonstrated similar flow patterns. During straight-line driving, the pressure acting on the tire sidewall was approximately 101.14 kPa. As the steering angle increased, the tire sidewall pressure distribution also showed a changing trend.
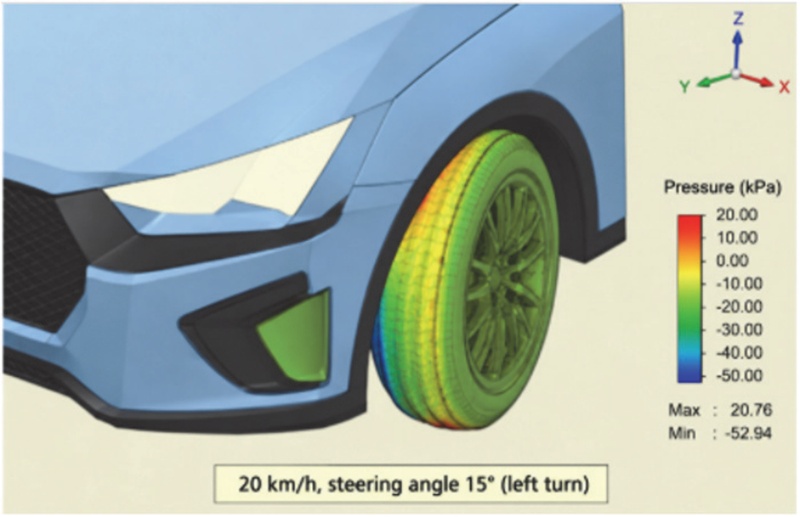
Pressure applied to the tires of a vehicle equipped with a Wheel Air Curtain when driving straight and when steering at a 15° or 30° angle
3.4 Experiment with Fluid Pressure Distribution by Applying Wheel Air Curtain Flap
Since the air pressure acting on the tire sidewall changes at steering angles of 15° or more, a structure was designed in this study to adjust the discharge direction of the Wheel Air Curtain Flap Duct according to steering conditions. With a Wheel Air Curtain Duct outlet shape based on an actual vehicle, CFD analysis compared changes in tire sidewall pressure distribution during turns at 15° and 30° under offset conditions of 10 mm and 20 mm.
As shown in Figs. 7 and 8, the tire sidewall pressure was approximately 101.94 kPa at a 15° turning angle under the 10 mm offset condition, but decreased to approximately 101.47 kPa at a 30° turning angle. In addition, increasing the Air Curtain Duct spacing slightly reduced the pressure acting on the tire sidewall, with the 30 mm condition producing a lower pressure distribution than the 20 mm condition.
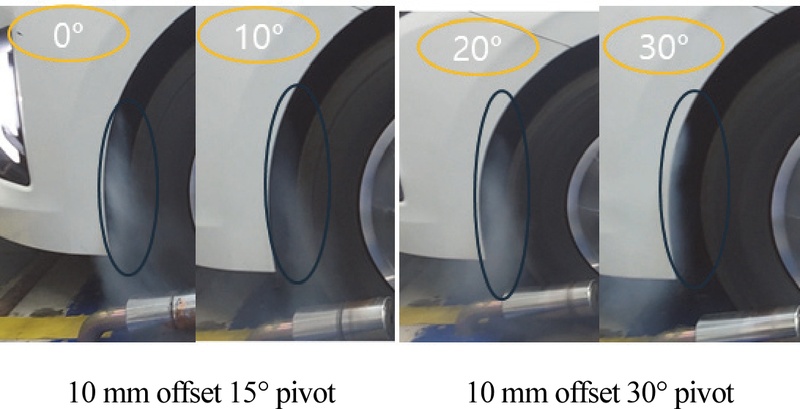
Comparison of tire pressures at 15° and 30° turns after 10 mm offset with Air Curtain Duct basic specifications
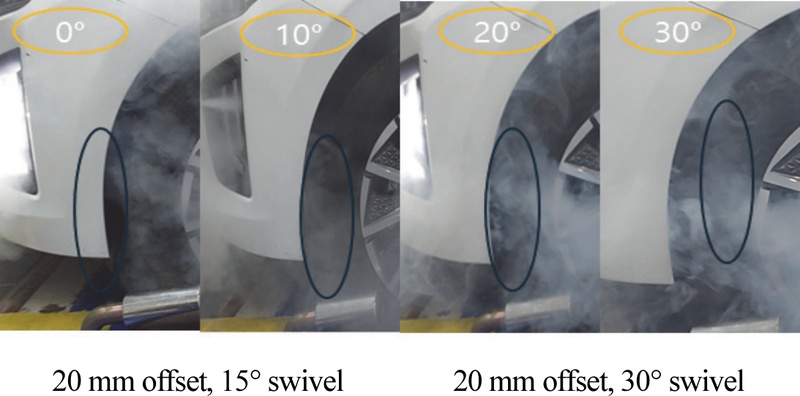
Comparison of tire pressures at 15° and 30° turns after 20 mm offset with Air Curtain Duct basic specifications
With the Air Curtain Duct spacing set at 40 mm, the pressure measured approximately 101.10 kPa during a 15° turn and approximately 101.26 kPa during a 30° turn. These results indicate that increasing the steering angle causes the flow passing through the Wheel Air Curtain to influence the flow inside the Wheel House more significantly than the tire sidewall. In particular, as the steering conditions increased, the flow alignment performance around the tire partially decreased, while turbulence and air resistance inside the Wheel House tended to increase relatively.
3.5 Visualization Experiment for Wheel Air Curtain Flap
The airflow around the stationary vehicle’s wheel was visualized with sprayed mist as the steering wheel angle was varied at 0°, 10°, 20°, and 30°. At a steering angle of 0°, the Wheel Air Curtain effect was visible. However, changes in the steering angle caused pressure interference around the wheel.
Visualization of the pressure applied to the wheel at steering angles of 0°, 10°, 20°, and 30° with the wheel stationary
When the wheel rotated (simulating a speed of 100 km/h) at steering angles of 0°, 10°, 20°, and 30°, the wheel air curtain efficiency decreased slightly. This reduction occurred because wind pressure generated by the wheel produced driving pressure between the wheel guide and the wheel, rather than the influence of the wheel air curtain.
Visualization of the pressure applied to the wheel at steering angles of 0°, 10°, 20°, and 30° with the wheel rotating (simulating 100 km/h)
Previous studies have reported a potential aerodynamic performance improvement of approximately 15 % when applying a Wheel Air Curtain. To further improve Wheel Air Curtain effectiveness by utilizing the wheel angle change resulting from steering input, experiments were performed with a flap installed at the Wheel Air Curtain outlet and aligned according to the steering angle.
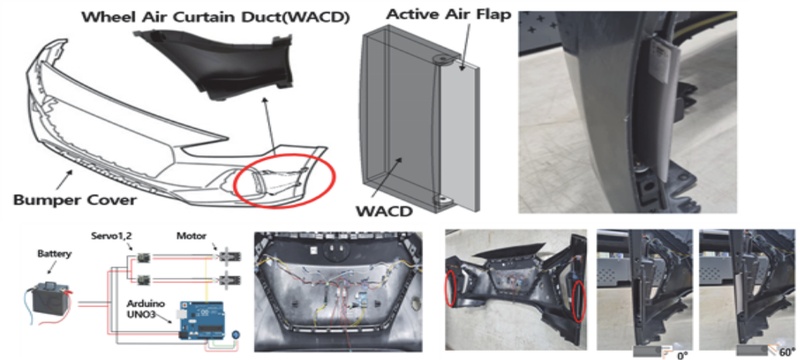
Wheel air curtain active air flap design method and shape manufacturing drawing
The Active Air Flap was used in an optimized experiment to control the airflow direction through the Wheel Air Curtain Duct (WACD) and reduce the friction fluid pressure generated on the tire surface10,11) during vehicle turning.
Flow trajectory analysis of the Wheel Air Curtain Active Air Flap design was performed while fog spraying was used to experimentally investigate pressure formation during driving and in the stationary condition. As shown in Figs. 12~14, adding the adjustable Active Air Flap to the Wheel Air Curtain design reduces the pressure exerted on the wheel. This result suggests that the system may perform more effectively under various steering conditions.
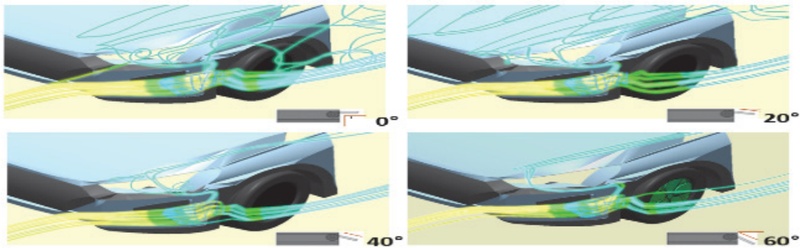
Flow trajectory analysis according to Wheel Air Curtain active air flap design
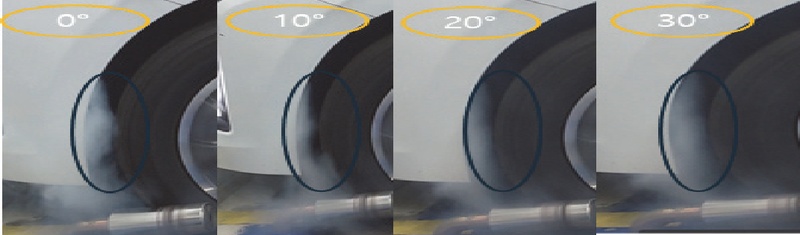
Flow visualization according to steering angle with 10° Active Air Flap control
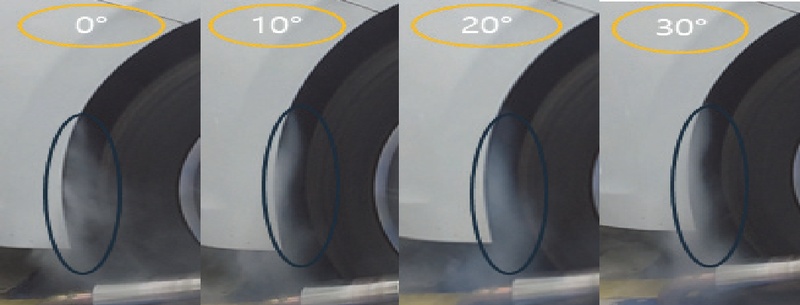
Flow visualization according to steering angle with 20° Active Air Flap control
The primary focus of this study was the analysis of pressure distribution changes. Future studies should address shape optimization, including an air curtain outlet designed asymmetrically based on the steering angle or a jet directed toward the outer side of the wheel arch. In particular, the bumper corner and front section of the wheel arch should be designed as an integrated structure because the tire protrudes farther toward the front during steering maneuvers.
4. Conclusion
- 1) For roads on which vehicles travel, design steering angles are 5–12° for expressways, 12–20° for general national highways, and 30–50° for ICs and sharp curves. Overall, steering maneuvers comprise approximately 15 % of a vehicle’s total travel distance.
- 2) During road driving, vehicles equipped with a Wheel Air Curtain exhibit an improvement of 15–25 % inaerodynamic performance. However, maintaining this benefit consistently is difficult when the steering angles change. If steering causes the wheel to protrude beyond the bumper edge, the Wheel Air Curtain may partially lose its ability to align the airflow.
- 3) Typical high-speed driving involves steering angles below 10°, and the resulting small steering inputs cause only limited aerodynamic changes associated with the Wheel Air Curtain. However, when greater steering inputs were required for overtaking, rapid lane changes, or sharp curves, increased airflow fluctuations were observed around the outer side of the tire. In addition, fitting wider wheels and tires to improve vehicle traction may increase tire protrusion and partially reduce the airflow alignment performance of the existing Wheel Air Curtain.
An Active Air Flap structure was therefore applied to adjust the discharge direction based on steering conditions. The results demonstrated its potential to mitigate airflow impact against the tire sidewall and provide more stable airflow control around the wheel during steering maneuvers. - 4) During a 15° steering maneuver, applying the Active Air Flap reduced tire sidewall pressure from the baseline value of 103.58 kPa to a range of 101.10–101.94 kPa. This reduction indicates that the flap can mitigate the impact of the Wheel Air Curtain (WAC) jet against the tire sidewall during steering.
- 5) This study proposes an active aerodynamic control concept that considers steering conditions, indicating its potential for future development into real-time aerodynamic control technology integrated with actual vehicle ECUs. Since the geometry of the Active Air Flap itself may generate additional drag, future work must quantitatively evaluate changes in the vehicle’s overall drag coefficient (Cd).
Acknowledgments
A part of this paper was presented at the KSAE 2022 Fall Conference and Exhibition
This research was supported by the Regional Innovation System & Education (RISE) program through the Gwangju RISE Center, funded by the Ministry of Education (MOE) and Gwangju Metropolitan City, Republic of Korea (2026-RISE-05-015).
References
- J. Katz, Race Car Aerodynamics: Designing for Speed, Bentley Publishers, 2016.
-
G. Wickern, K. Zwicker and M. Pfadenhauer, “Rotating Wheels - Their Impact on Wind Tunnel Test Techniques and on Vehicle Drag Results,” SAE 970133, 1997.
[https://doi.org/10.4271/970133]

-
J. Lee, S. Park, M. Kim, Y. Kim and B. Oh, “Vehicle Aerodynamic Drag for Tire Shape Parameters Using Numerical Analysis,” International Journal of Automotive Technology, Vol.23, No.2, pp.335-344, 2022.
[https://doi.org/10.1007/s12239-022-0031-0]
-
S. O. Kang, J. H. Cho, S. O. Jun, H. I. Park, K. S. Song and J. D. Kee, “A Study of an Active Rear Diffuser Device for Aerodynamic Drag Reduction of Automobiles,” SAE 2012-01-0173, 2012.
[https://doi.org/10.4271/2012-01-0173]
-
R. Tandon, M. R. Agrewale and K. Vora, “Aerodynamic Analysis of a Passenger Car to Reduce Drag Using Active Grill Shutter and Active Air Dam,” SAE 2019-28-2408, 2019.
[https://doi.org/10.4271/2019-28-2408]
-
A. Cogotti, “A Parametric Study on the Ground Effect of a Simplified Car Model,” SAE 980031, 1998.
[https://doi.org/10.4271/980031]
-
P. W. Bearman, “Some Observations on Road Vehicle Wakes,” SAE 840301, 1984.
[https://doi.org/10.4271/840301]
- B. R. Son, Y. J. Jang, Y. I. Kim and C. S. Park, “A Study on the Shape Optimization of Variable Active Air Flap due to Vehicle Steering Angle,” KSAE Annual Conference Proceedings, p.1393, 2022.
-
J. Feng, M. Duan, L. Qin, Y. Chen, S. Huang and Q. Wang, “Optimization of Aerodynamic Performance by Applying the Combination of Lamellar and 3D Wheel Deflectors on the SUV Model,” Proceedings of the Institution of Mechanical Engineers, Part D: Journal of Automobile Engineering, Vol.239, No.4, pp.1300-1310, 2025.
[https://doi.org/10.1177/09544070231216200]
- W. H. Hucho, Aerodynamics of Road Vehicles, 5th ed., SAE International, 2013.
-
D. Antanaitis, “Measuring and Characterizing Brake System Performance During Race Track/High Energy Driving Conditions,” SAE 2005-01-0790, 2005.
[https://doi.org/10.4271/2005-01-0790]