차량 종 방향 거동을 고려한 자율주행 패턴의 입력변수 최적설계
Copyright Ⓒ 2023 KSAE / 210-07
This is an Open-Access article distributed under the terms of the Creative Commons Attribution Non-Commercial License(http://creativecommons.org/licenses/by-nc/3.0) which permits unrestricted non-commercial use, distribution, and reproduction in any medium provided the original work is properly cited.
Abstract
With the development of highly automated autonomous vehicle technology, the role of human beings has changed from that of an active driver to a passive passenger. So, many studies that evaluate the preference for autonomous driving from the user's point of view are being actively conducted. Research related to autonomous driving is mainly performed by using simulation-based technology in a virtual environment, or using real vehicles for testing purposes. The test method that uses virtual environment driving simulations allows the same conditions to be repeatedly provided to the test driver. Likewise, autonomous driving patterns can be defined in numerical values, so autonomous driving patterns that suit various driver preferences can be implemented. In this study, an optimal design with 13 parameters for a comfortable pattern that minimizes the standard deviation of the longitudinal acceleration of the ego car was performed. To examine the new autonomous driving pattern, simulations set in two situations for surrounding vehicles were performed.
Keywords:
Virtual test drive, Autonomous driving patterns, Input parameters, Artificial neural network, Optimal design키워드:
버추얼 테스트 드라이브, 자율주행 패턴, 입력변수, 인공신경망, 최적설계1. 서 론
자율주행 차량에 대한 관심과 기술력이 높아지면서 최근 국토교통부는 레벨3 부분 자율주행 차량의 양산허가를 위한 안전기준을 세계최초로 제정하였으며,1) 레벨4 자율주행차 제작ㆍ안전 가이드라인을 발표하여 자율주행의 안전성 및 사회적 수용성을 높이기 위한 13개 안전항목을 제시하였다.2) 이러한 정부 차원 움직임의 주요 원인은 미국자동차기술자협회(Society of Automotive Engineers) 등에서 제시한 자율주행단계 고도화에 따른 차량사고의 책임이 운전자가 아닌 시스템으로 이양되기 때문이다. 즉, 자율주행 기술의 작동범위가 자동차 전용도로에 국한되었던 첨단 운전자 보조 시스템(Advanced Driver Assistance System)과 달리 도심을 포함한 모든 도로영역으로 확대되어 다양한 위험상황에 대한 대처가 필수적이다.
따라서 자율주행 관련 연구는 주로 가상환경으로 구현된 시뮬레이션 기반 기술3-5)을 이용하거나 시험용 실제 차량을 활용하는 방식6,7)으로 진행되고 있다. 여기서 실차 기반의 자율주행 차량을 시험 도구로 활용하면 실제 주행상황에서 느낄 수 있는 심리적인 영향 등을 전반적으로 평가할 수 있지만 안전 관련 문제의 이유로 시험 환경 조성에 제약이 발생된다. 그러나 가상환경 주행 시뮬레이션을 이용한 시험방법의 장점은 반복적으로 동일한 조건을 피 실험자에게 제공할 수 있으며, 정량화된 수치로 주행패턴을 정의할 수 있어 다양한 운전자의 성향에 적합한 자율주행 패턴을 구현하거나 이를 수정하는 것이 상대적으로 용이하다.8)
한편, 개인의 운전성향은 습관적인 운전 방식으로 설명될 수 있다.9) 이러한 습관적인 운전 방식을 평가하는 요인으로 개별 성향에 따른 주행속도, 추월 행위 및 차간거리와 감ㆍ가속도 등이 있다.10) 하지만 운전자마다 차이가 나는 운전행태를 규정하여 자율주행 패턴을 구현하는 것은 어려운 일이다. 따라서 선행연구에서는 이용자들이 신뢰하는 자율주행 주행행태 측정을 위하여 공격적인(Aggressive) 성향과 보수적인(Conservative) 성향으로 구분하였으며, 대체적으로 다음과 같은 공통된 특징을 갖는다.11-13) 우선, 공격적인 성향은 주행속도가 상대적으로 빠르고, 차로변경, 추월 등의 상황에서 과감한 행태를 보이는 반면, 보수적인 성향의 경우 공격적 성향과 반대되는 행태를 보인다. 이때, 연구자들은 실험에 참가한 피 실험자가 행태 간 차이를 분명하게 인지할 수 있도록 설계하고 그에 따라 평가된 값을 기반으로 행태를 도출하였지만, 이용자가 기대하는 수준의 다양한 자율주행 주행행태 구현에는 한계를 보였다.8)
따라서 본 연구에서는 Table 1과 같이 전 세계적으로 활용되고 있는 HEXAGON社의 가상환경 기반 교통 시뮬레이션 프로그램인 VTD(Virtual Test Drive)14)에서 정의한 총 5가지 자율주행 패턴(Insecure/Brisk/Hasty/Comfortable/Default)을 기반으로 자율주행 차량 이용자의 요구에 부합하는 다양한 자율주행 패턴 개발을 위하여 관련 입력변수 13개에 대한 민감도분석과 최적설계를 진행하고자 한다. 이는 궁극적으로 제동장치와 조향장치와 같은 제어기 하드웨어 개발을 통한 제어기 연동 시뮬레이션의 기초자료로 활용될 것이다.
2. 자율주행 패턴 입력변수
VTD14)에서는 서론에서 언급한 것처럼 Table 1과 같이 총 5가지 자율주행 패턴을 정의하고 있으며, 주행행태를 다양하게 정의한 이유는 이용자가 기대하는 수준으로 자율주행 차량이 동작하지 않을 경우 멀미를 하거나 불편한 감정을 느낄 수 있기 때문이다.8)
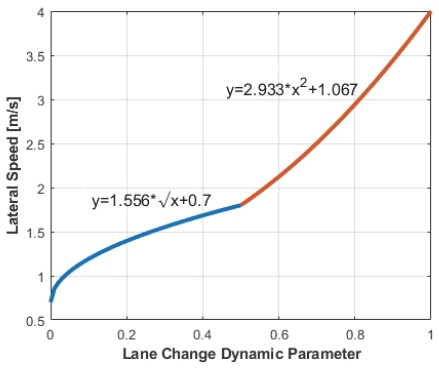
Table 2는 상기의 자율주행 패턴 정의를 위한 13개 입력변수 값을 나타낸다. 각각의 입력변수는 제어차량(Ego car)의 희망 주행속도(Desired velocity)부터 차량 기능 활용도(Use of indicator)까지 다양한 의미를 갖고 있으며, VTD에서는 0.5 값을 기준으로 하한구간과 상한구간이 상이한 특성을 갖도록 함수의 형태로 정의하여 주행행태에 적합한 입력변수가 되도록 구성하였다. 예로써 제어차량의 차선변경 시 목표로 하는 횡 방향 속도 값을 의미하는 차선 변경 다이내믹(Lane change dynamic) 입력변수의 속성 정의를 위한 특성 함수는 Fig. 1과 같다.
즉, 차선 변경 다이내믹 입력변수 값이 0.4인 경우 목표 횡 방향 속도는 1.6838(m/s)이며, 0.5에 해당하는 1.8(m/s) 보다 작은 값이 적용되어 차선변경 시 활용되는 것을 의미한다.
3. 가상 주행환경 구축
3.1 K-City 주행경로 생성
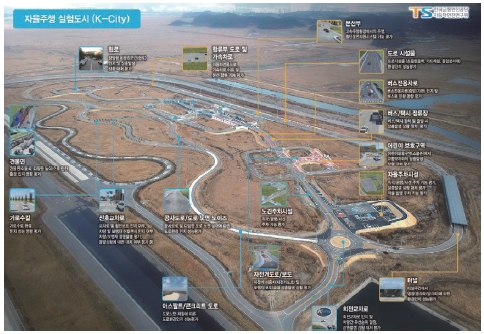
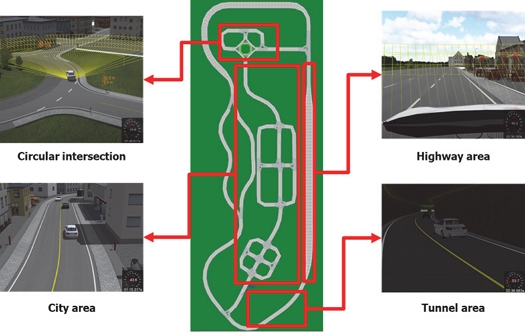
Fig. 2에 나타낸 K-City는 자율주행 차량의 안전성 검증을 위하여 5개 구역(자동차전용도로/도심부/커뮤니티(Community)부/교외도로/자율주차시설)으로 구분된 도로환경과 총 35종의 도로인프라(톨게이트, 신호/비 신호교차로 등)를 갖춘 대표적인 자율주행 테스트베드이다.15) 본 연구에서는 VTD에서 제공하는 자율주행 패턴 검증을 위해 OpenDRIVE 기반의 가상환경 K-City 주행경로를 생성하였으며, 정적요소인 도로는 Fig. 3에 나타낸 오픈소스 지도서비스의 일종인 한국 오픈스트리트맵(Open street map korea)과 국토정보플랫폼에서 제공하는 정밀 도로지도를 참고하여 차선종류와 폭 등의 세부정보를 반영하였다.
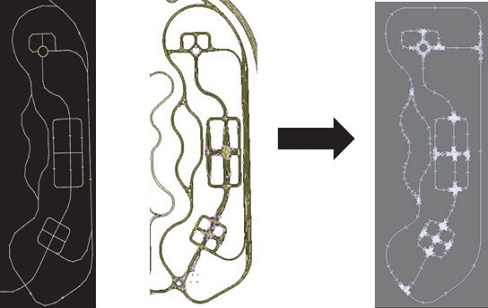
OpenDRIVE modeling process based on the open street map and precision road map by land information platform
추가로 OpenDRIVE에서는 스타일(Style) 항목을 이용하여 주변 환경 물체에 대하여 정의할 수 있으며, OpenDRIVE는 그래픽 데이터에 대한 위치 정보만을 포함하므로 실제 그래픽 데이터는 별도로 관리된다. 즉, VTD의 가상환경은 OpenDRIVE라는 도로 네트워크 파일과 Osgb(Open scene graph) 형식의 그래픽 파일로 구성되며, 본 연구에서는 Fig. 4와 같이 VTD에서 제공하는 기본적인 빌딩, 나무, 가드 레일 및 신호등과 같은 그래픽 데이터의 위치정보를 활용하여 그래픽 요소를 모델링하였다.16)
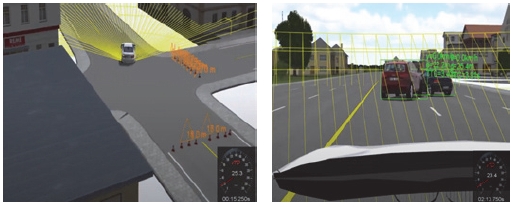
한편, 새롭게 구성한 도로네트워크 모델의 불연속 구간에 의한 시뮬레이션 오류 가능성 사전검토를 위해 Fig. 5와 같이 공사구간 우회와 사고차량 회피 등의 의도된 시나리오를 적용한 검증을 수행하여 도로 모델링에 문제없음을 확인하였다.
3.2 자율주행 시나리오 모델링
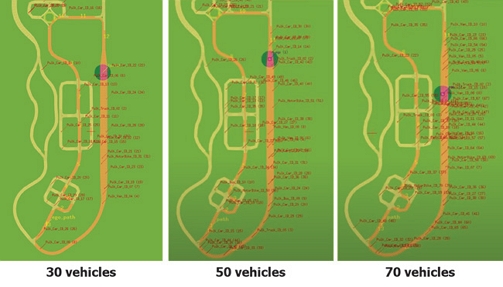
본 연구에서는 오브젝트의 동적거동 표현을 위하여 ASAM(Association for Standardization of Automation and Measuring System)에서 정의한 OpenSCENARIO 표준을 활용하여 시나리오를 구성하였다. 즉, VTD에서 제공하는 랜덤 교통류(Random traffic)인 펄크 트래픽(Pulk traffic)을 적용하여 제어차량(Ego car) 주위에 교통모델이 생성되도록 하였으며, 이러한 교통모델의 생성조건은 다음과 같다. 우선 도심지역에서의 원활한 교통흐름 관리를 위해 Fig. 6과 같이 제어차량 중심으로 최소 10대부터 최대 90대까지 20대 간격으로 교통량을 생성하여 시뮬레이션에 적합한 교통량을 50대로 선정하였으며, 제어차량이외의 주변차량은 Default 자율주행 패턴을 적용하였다.
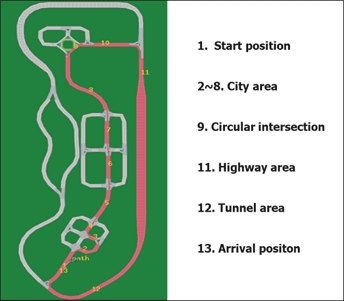
이때, 제어차량은 2009연식 BMW 7series 모델이며, Fig. 7의 경로를 따라 1번 위치에서 초기속도 30 km/h로 주행을 시작하여 13번 위치에서 4 m/s2 감속도로 정차하는 약 2.2킬로미터의 주행경로를 구성하였다. 또한, 차량분포는 제어차량 중심으로 전방 40 %, 후방 30 %, 좌측 15 %와 우측 15 %로 정의하였으며, 차량종류 분포는 승용차 80 %, 밴 10 %, 트럭 5 % 및 이륜차 5 %로 설정하였다. 마지막으로 주행경로에 대한 일반적인 주행상황을 시나리오로 구성하여 대표적인 자율주행 패턴에 대한 특성을 평가하였다.
4. 자율주행 패턴 입력변수 최적설계
4.1 목적함수 정의
가속도 표준편차는 차량 주행 시 운전자가 원하는 속력으로 주행하고자 할 때, 도로 위 차량흐름이나 교통제어 등의 영향으로 많은 변화가 발생한다.17) 이러한 가속도 표준편차에 영향을 미치는 주요 3가지 요소는 운전자, 도로 및 교통상태이며, 일반적으로 공격적 성향의 운전행태, 도시부의 단속교통류 상태와 혼잡상태의 많은 교통량에서 속도 변화폭이 크게 발생한다. 따라서 본 연구에서는 3장에서 구성한 주행경로와 시나리오를 활용한 시뮬레이션을 통해 상기의 요인 중 도로와 교통상태를 동일하게 구성하여 자율주행 패턴의 운전행태 평가를 수행하고자 하며, Fig. 7의 주행경로에서 지배적으로 나타나는 차량 종 방향 거동 고려를 위해 종 방향 가속도(Longitudinal acceleration) 표준편차를 목적함수로 설정한다.
4.2 설계인자 민감도 분석
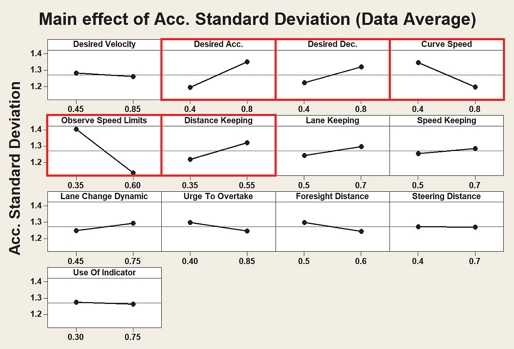
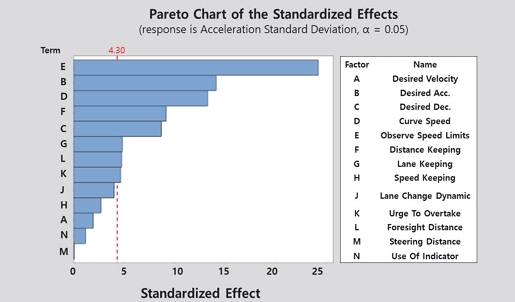
2장에서 언급한 Table 1의 자율주행 패턴 중 Comfortable 패턴을 대상으로 13개 입력변수에 대한 최적설계를 위하여 민감도 분석(Sensitivity analysis)을 수행하였다. 5개의 자율주행 패턴 중 Comfortable 패턴을 대상으로 선정한 이유는 대부분의 평범한 운전자에게서 나타나는 운전성향인 ‘가속과 감속을 급하게 하지 않으면서 차간 거리를 적절히 유지하는 성향’이기 때문이다. 일반적으로 13개의 설계변수를 고려한 2수준 요인배치법의 실험횟수는 213으로 총 8,192번의 실험을 수행해야 하며, 많은 실험점(Design point)을 이용한 민감도 분석(Sensitivity analysis)은 경제적, 시간적으로 불가능하다. 따라서 본 연구에서는 Taguchi 방법을 이용하였으며, 이 방법은 최소의 실험으로 2수준의 주 효과만을 고려할 수 있는 기법으로써 설계인자 별 교호작용은 무시된다. 따라서 설계인자 13개에 대한 실험계획 및 각 실험점에 대한 자율주행 시뮬레이션 결과는 Table 3과 같다. 즉, 13개의 설계인자에 대하여 16번의 자율주행 시뮬레이션을 수행하고, 목적함수인 제어차량의 종 방향 가속도의 표준편차를 도출한 것이며, 이에 대한 민감도 분석결과는 Fig. 8 및 Fig. 9와 같이 나타낼 수 있다. 여기서 목적함수에 가장 영향도가 큰 주요인자는 Fig. 9에 나타낸 것처럼 Observe speed limits, Desired acceleration, Curve speed, Distance keeping과 Desired deceleration 순이다.
4.3 실험계획법(DOE)과 인공신경망(ANN)을 이용한 최적설계
본 절에서는 민감도 분석을 통하여 선정한 5개의 주요 설계변수에 대하여 목적함수인 제어차량의 종 방향 가속도의 표준편차를 최소화하기 위하여 실험계획법과 인공신경망(Artificial neural network)을 이용하여 최적설계를 수행한 것이다. 이를 위한 최적화 문제 정의는 식 (1)과 같다.
| (1) |
여기서 x는 설계변수로써 Desired acceleration, Desired deceleration, Curve speed, Observe speed limits와 Distance keeping이며, f(x)는 최소화하기 위한 목적함수로써 제어차량의 종 방향 가속도의 표준편차이다. 또한, lower와 upper는 설계변수가 존재할 수 있는 설계 영역의 하한과 상한(Side constraint)을 의미한다.
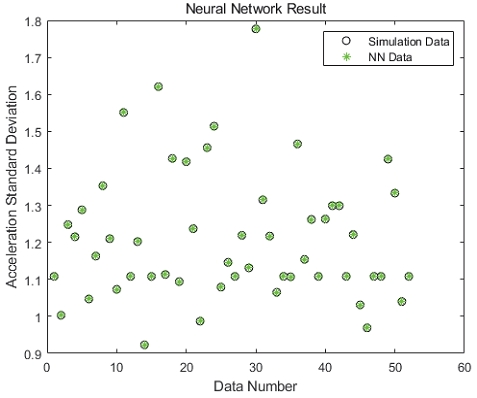
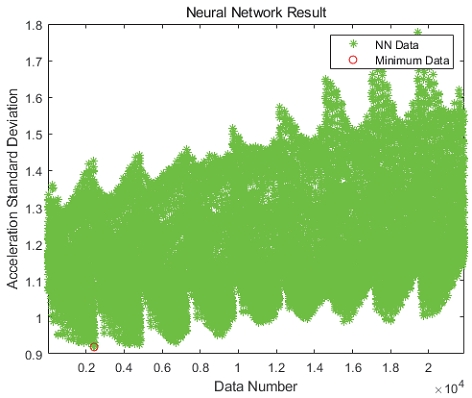
Table 4는 반응표면설계에 많이 활용되는 중심합성계획법(Central composite design)을 이용한 실험점과 시뮬레이션 결과를 나타낸 것이며, Fig. 10은 이에 대하여 인공신경망을 이용한 학습결과를 나타낸 것이다. 이때, 구성된 인공신경망의 히든 레이어(Hidden layer) 층수와 크기는 각각 1과 294이며, 학습결과의 정확도를 나타내는 RMSE(Root Mean Square Error)는 1.221×10⁻⁵가 얻어졌다. 상기와 같이 구성된 인공신경망을 이용하여 목적함수를 최소로 하는 설계변수 탐색을 위해 각 입력변수별로 0.05의 간격을 적용하여 Desired acceleration은 0.4 ~ 0.8을 9등분, Desired deceleration은 0.4 ~ 0.8을 9등분, Curve speed는 0.4 ~ 0.8을 9등분, Observe speed limits는 0.35 ~ 0.6을 6등분 및 Distance keeping은 0.35 ~ 0.55를 5등분으로 분할하여 총 21,870개의 실험데이터를 구성하였다. Fig. 11은 실험데이터를 적용한 결과이며, 최적화 된 설계변수 값은 Desired acceleration 0.4, Desired deceleration 0.8, Curve speed 0.8, Observe speed limits 0.55와 Distance keeping 0.55가 얻어졌다. 이러한 결과는 설계변수 자체의 제한조건에 걸리지 않는 값이므로 근사최적해이며, 이때의 목적함수는 0.919(m/s2)이었다.
4.4 최적화 결과 고찰
본 절에서는 4.3절에서 얻어진 최적화 결과의 검증을 수행한 것이며, Table 5는 VTD에서 제공한 기존의 Comfortable 패턴과 인공신경망을 통해 얻어진 5개 주요 설계변수의 최적 값을 적용한 새로운 자율주행 패턴을 나타낸 것이다. 이러한 새로운 자율주행 패턴을 이용한 시뮬레이션 결과 제어차량의 종 방향 가속도의 표준편차는 0.927(m/s2)이 얻어졌으며, 이는 인공신경망을 통해 예측된 0.919(m/s2)와 0.87 %의 오차를 나타내어 인공신경망의 학습결과가 매우 신뢰할 수 있는 수준임을 확인하였다. 이때 제어차량을 제외한 주변차량 50대에 대해서는 Default 자율주행 패턴을 적용하였다.
한편, 새로운 자율주행 패턴의 적용가능성 검토를 위해 주변차량 50대를 Table 6과 같이 2가지 상황으로 설정하고 기존 Comfortable 패턴과 목적함수를 비교하였다. 즉, 교통흐름이 원활하도록 주변차량을 Default 패턴만으로 구성한 시나리오와 실제 교통상황과 유사한 랜덤 교통류에 맞는 Insecure, Hasty와 Comfortable이 혼합된 환경으로 설정하고 시뮬레이션을 수행하였다. 시뮬레이션 결과 주변차량이 Default인 경우 새로운 자율주행 패턴의 종 방향 가속도 표준편차가 약 18 % 작은 값이 얻어져 보다 안정적인 주행을 하지만 랜덤 교통류 상황에서는 반대의 결과가 얻어졌다. 이러한 결과가 발생한 큰 원인은 새로운 자율주행 패턴 최적화 시 주변차량을 Default로 설정했기 때문이며, 그러므로 향후에는 주변차량을 랜덤 교통류로 설정하고 최적화를 수행할 필요가 있다.
5. 결 론
본 연구에서는 자율주행 차량 이용자의 요구에 부합하기 위하여 VTD에서 제공하는 대표적인 5가지 자율주행 패턴 중 Comfortable 패턴의 13개 입력변수에 대한 민감도 분석과 최적설계를 수행하여 다음과 같은 결론을 얻었다.
- 1) 민감도 분석을 통해 5개의 주요 설계변수 Desired acceleration, Desired deceleration, Curve peed, Observe speed limits와 Distance keeping을 도출하였다.
- 2) 실험계획법과 인공신경망을 이용하여 상기의 주요 설계변수에 대한 최적화를 수행하였으며, 인공신경망의 근사최적해의 자율주행 시뮬레이션을 통해 0.87 %의 오차가 얻어져 인공신경망의 학습결과가 매우 신뢰할 수 있는 수준임을 확인하였다.
- 3) 새로운 자율주행 패턴의 적용가능성 검토를 위해 주변차량 50대에 대하여 2가지 상황으로 설정한 시뮬레이션 결과를 고려하여 향후에는 주변차량을 랜덤 교통류로 설정하고 최적화를 수행할 필요가 있음을 확인하였다.
Acknowledgments
A part of this paper was presented at the KSAE 2022 Spring Conference
이 연구는 국토교통부가 지원하는 국토교통과학기술진흥원 보조금(22HBST-C158067-03)으로 수행되었다.
References
- MOLIT(Minister of Land, Infrastructure and Transport), Established the World’s First Partially Autonomous Vehicle (Level 3) Safety Standard, 2020.
- MOLIT(Minister of Land, Infrastructure and Transport), Level 4 Autonomous Vehicle Manufacturing Safety Guidelines, 2020.
-
C. Basu, Q. Yang, D. Hungerman, M. Singhal and A. D. Dragan, “Do You Want Your Autonomous Car To Drive Like You?,” Proceedings of the 2017 ACM/IEEE International Conference on Human-Robot Interaction, pp.417-425, 2017.
[https://doi.org/10.1145/2909824.3020250]

-
R. H. Y. Ma, A. Morris, P. Herriotts and S. Birrell, “Investigating What Level of Visual Information Inspires Trust in a User of a Highly Automated Vehicle,” Applied Ergonomics, Vol.90, Paper No. 103272, 2021.
[https://doi.org/10.1016/j.apergo.2020.103272]

-
S. Haghzare, J. L. Campos, K. Bak and A. Mihailidis, “Older Adults’ Acceptance of Fully Automated Vehicles: Effects of Exposure, Driving Style, Age, and Driving Conditions,” Accident Analysis & Prevention, Vol.150, Paper No.105919, 2021.
[https://doi.org/10.1016/j.aap.2020.105919]

-
L. Oliveira, K. Proctor, C. G. Burns and S. Birrell, “Driving Style: How Should an Automated Vehicle Behave?,” Information, Vol.10, No.6, pp.1-20, 2019.
[https://doi.org/10.3390/info10060219]

-
N. Dillen, M. Ilievski, E. Law, L. E. Nacke, K. Czarnecki and O. Schneider, “Keep Calm and Ride Along: Passenger Comfort and Anxiety as Physiological Responses to Autonomous Driving Styles,” Proceedings of the 2020 CHI Conference on Human Factors in Computing Systems, pp.1-13, 2020.
[https://doi.org/10.1145/3313831.3376247]

- S. C. Hwang, D. M. Lee, G. O. Jeong, S. Y. Park and D. H. Kim, “Evaluation of Automated-Vehicle Behavior Preference Based on Driving Traits Using a Driving Simulator,” Journal of Transport Research, Vol.28, No.2, pp.67-82, 2021.
-
J. Elander, R. West and D. French, “Behavioral Correlates of Individual Differences in Road-traffic Crash Risk: an Examination Method and Findings,” Psychological Bulletin, Vol.113, No.2, pp.279-294, 1993.
[https://doi.org/10.1037/0033-2909.113.2.279]

- S. C. Hwang, Preference Assessments of Automated Driving Patterns Based on Driver’s Propensity, Ph.D. Dissertation, University of Seoul, Seoul, 2022.
-
J. D. Lee, S. Y. Liu, J. Domeyer and A. DinparastDjadid, “Assessing Drivers’ Trust of Automated Vehicle Driving Styles with a Two-Part Mixed Model of Intervention Tendency and Magnitude,” Human Factors, Vol.63, No.2, pp.197-209, 2021.
[https://doi.org/10.1177/0018720819880363]

-
H. Bellem, B. Thiel, M. Schrauf and J. F. Krems, “Comfort in Automated Driving: An Analysis of Preferences for Different Automated Driving Styles and Their Dependence on Personality Traits,” Transportation Research Part F: Traffic Psychology and Behaviour, Vol.55, pp.90-100, 2018.
[https://doi.org/10.1016/j.trf.2018.02.036]

-
F. Ekman, M. Johansson, L. O. Bligård, M. Karlsson and H. Strömberg, “Exploring Automated Vehicle Driving Styles as a Source of Trust Information,” Transportation Research Part F: Traffic Psychology and Behaviour, Vol.65, pp.268-279, 2019.
[https://doi.org/10.1016/j.trf.2019.07.026]

- User Manual of VIRES Driver Behavior, VIRES Simulationstechnologie GmbH, pp.1-49, 2019.
- H. G. Go, “Phase 1 Construction and Improvement Plan of K-City,” Auto Journal, KSAE, Vol.41, No.6, pp.28-31, 2019.
-
W. Y. Kang, J. H. Jo, M. K. Lee, D. O. Kang, M. S. Hyun and S. J. Heo, “A Study on the Methodology to Develop Virtual Drive Environment for Autonomous Driving Evaluation,” Transactions of KSAE, Vol.29, No.6, pp.547-556, 2021.
[https://doi.org/10.7467/KSAE.2021.29.6.547]

- D. L. Gerlough and M. J. Huber, Traffic Flow Theory, TRB National Research Council, pp.102-105, 1976.

