Comparison and Analysis of Controller Area Network Compression Algorithms
Copyright Ⓒ 2020 KSAE / 178-05
This is an Open-Access article distributed under the terms of the Creative Commons Attribution Non-Commercial License(http://creativecommons.org/licenses/by-nc/3.0) which permits unrestricted non-commercial use, distribution, and reproduction in any medium provided the original work is properly cited.
Abstract
Today, as the number of electronic control units(ECUs) in automotives increases, the complexity of in-vehicle network also increases. Controller area network(CAN) is the most widely used protocol in in-vehicle network but it has limited bandwidth. CAN buses with limited bandwidth may increase in bus load due to the increased complexity of the CAN bus. Thus, low priority messages in CAN bus may be delayed or missed, making it difficult to predict the worst-case latency. There have been studies on data compression algorithms to reduce the amount of data transmitted on the CAN bus at a low cost. However, it is difficult to select the optimal compression algorithm because previous studies utilized different experimental environments, so it is difficult to compare performance across each study. This paper presents peak load and worst-case message latency when using representative data compression algorithms. Each algorithm was measured in the same experimental environment that implemented using CANoe in order to compare performance.
Keywords:
Controller Area Network(CAN), Compression algorithm, Data reduction, In-vehicle networks1. Introduction
Currently, automobiles are equipped with various electronic control units(ECUs) to provide advanced technologies such as advanced driver assistant system(ADAS),1) autonomous driving system,2) or in-vehicle infortainment (IVI).3) The ECU in automobiles is connected through in-vehicle network protocols such as the controller area network(CAN) or local interconnect network(LIN). The increasing number of ECUs needed to provide these various functions is causing various problems due to the consequently higher complexity of in-vehicle networks.
CAN communication has become the most widely used protocol because of its high reliability and significant price benefits. However, CAN communication has difficulty sending and receiving various messages required in the vehicle because it only supports a bandwidth of up to 1 Mbps. Particularly when the bus occupancy is high, low-priority messages may be delayed or omitted according to the priority competition of the CAN. Moreover, maximum latency is difficult to predict due to the nature of CAN communication, which operates by the event trigger method, making it difficult to use in a vehicle, where a real-time system is critical for safety.4-6)
Various methods to solve this problem have been discussed, such as using new high-speed communication protocols that support a larger bandwidth such as FlexRay or Ethernet, and using separate buses for multiple CANs.7) However, these methods require a wide range of changes for existing vehicle systems and may raise prices or cause a reliability issue. To address this problem, Time-Triggered Controller Area Network(TTCAN)8,9) and CAN with Flexible Data rate(CAN FD)10,11) have emerged. The TTCAN sends messages according to a predefined schedule to avoid unnecessary data collision in the network and can obtain higher predictability and determinism than CAN. The CAN FD can send up to 64 bytes at a maximum rate of 8 Mbps in the data transfer stage although it sends data at the same rate as CAN in the bus arbitration stage. As a measure to solve the CAN bandwidth problem while minimizing price increase and reliability problems, the data reduction(DR) algorithm has been developed.12) The DR algorithm can decrease the use of the CAN bandwidth by shortening the data to be transmitted using data compression. Furthermore, the DR algorithm is applicable without requiring a separate change of hardware by applying only the compression and decompression algorithms to the ECU. It has the advantage of improving the CAN bandwidth problem by changing only the software of the controller for sending and receiving specific messages without changing all controllers connected to the network, unlike what is required by other new high-speed communication protocol utilization and multiple bus methods.
According to the above-mentioned advantage, various DR algorithms have been researched, including Enhanced Data Reduction(EDR),7) Quotient Remainder Compression (QRC),13) and Boundary of Fifteen Compression(BFC).6) The DR algorithm compresses the data field of CAN messages in byte units. After comparing each byte of the current CAN message with each byte of the previous message, it does not send unchanged bytes. The EDR algorithm compresses CAN messages in the signal unit. It obtains differences between the current CAN signal and the previously sent CAN signal, and based on the difference value, it performs full compression, delta compression, or no compression of the signals. In addition, it groups and manages signals of 5 or lower bits. The QRC algorithm is basically similar to the EDR algorithm. It sets a divisor for each signal and finds the quotient and remainder of the signal value divided by the divisor. Then it compresses signals by comparing the quotient of the previous signal with the quotient of the current signal. The BFC algorithm compresses the CAN signal if the current value of the CN signal changes within ±15, which is the maximum compression range.
Although various data compression algorithms have been conducted, their performances cannot be compared with one another because each algorithm was experimented in a different environment. Research should be conducted to compare and analyze the performances of various algorithms under the same environment. In this study, the performance of each algorithm is tested by measuring the maximum bus load and message latency, which are important factors in improving the CAN bandwidth problem under the same experimental environment.
This paper is organized as follows. Chapter 2 briefly explains the existing compression algorithms used in this study. Chapter 3 explains the experimental environment and method for comparing the data compression algorithms used in this study. Chapter 4 concludes this paper.
2. Existing Works
In this chapter, the compression and decompression methods of the CAN communication data compression algorithm to be used for the experiments are briefly introduced.
The CAN data compression algorithms are based on the characteristic that the data frames of the same message identifier sent consecutively do not change quickly.6,7,12-17)
2.1 Data Reduction
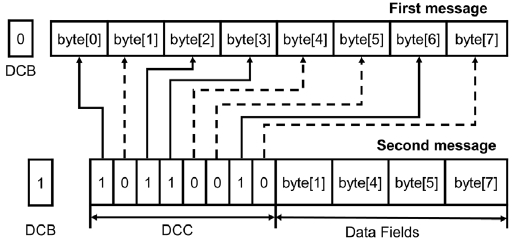
The DR algorithm indicates whether or not the message is compressed using a reserved bit in the control area of the CAN message,12) which is called the DCB bit. The DCB becomes “1” if the message is compressed; otherwise, it is “0”. The first byte in a compressed CAN message is the header byte, which is called data compression code(DCC). The position of each bit of the DCC corresponds to the byte position of the existing uncompressed message. If this byte is not different from the previously sent byte, the DCC bit becomes ‘1’. If it is different from the previously sent byte, the DCC bit becomes ‘0’. The changed bytes are placed one after another behind the compressed code and sent to the bus. If all bytes have been changed from the previous message, the original message is sent without compression. If there are unchanged bytes, the compressed message is sent.
Fig. 1 shows uncompressed first message and compressed second message. Since the first message is not compressed, the DCB bit becomes ‘0’ and the original 8-byte message is sent without change. The second message is a compressed message and only 5 bytes are sent. The bytes 0, 2, 3, and 6 were not changed from the previous message, and bytes 1, 4, 5, and 7 were changed. Therefore, the DCC becomes ‘10110010’ and the message only contains the changed bytes 1, 4, 5 and 7.
2.2 Enhanced Data Reduction
The EDR algorithm does not use a separate bit to indicate message compression, because the receiving node already knows the data length code(DLC) of the uncompressed original data field of each message.7) The receiving node determines whether or not the message is compressed by checking the data field length of the received message.
The EDR algorithm divides the signals of messages into two types. One type is SDN(signal, data, no-change) signals, which correspond to periodically sent signals with a length of 5 bits or more such as vehicle speed or engine speed. The SDN signals are expressed as all signals, difference in signal value, and no change. The other type is SN(signal, nochange) signals, which correspond to state signals with a length of 4 bits or less such as gear state and engine state. The SN signals are expressed as no change or all signals, and multiple SN signals are grouped.
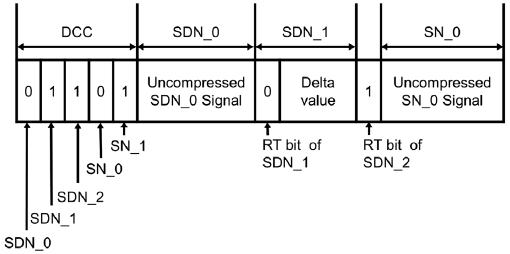
In the EDR algorithm as well, the first byte of the compressed message is DCC. The position of each bit of DCC corresponds to the position of data byte of the original uncompressed message. If the DCC bit is ‘0’, it indicates that the corresponding signal is not compressed; if it is ‘1’, it indicates that the corresponding signal is delta-compressed or fully compressed. The compressed SDN signal indicates delta compression(RT=0) or full compression(RT=1) by the Reduction Type(RT) bit.
Fig. 2 shows a sample message compressed by the EDR algorithm. It is assumed that one SDN signal is delta-compressed, and one SDN and one SN signal are fully compressed. The compressed message has a five-bit DCC and two RT bits. The delta-compressed SDN signal sends the difference between the previous and current signals for the predefined delta length. If the signal is fully compressed, only the RT bit is sent. If the SN signal group is fully compressed, nothing is sent. If any one signal in the group is changed, all the signals in the group are sent.
2.3 Quotient Remainder Compression
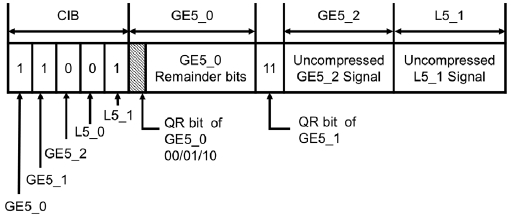
The QRC algorithm is similar to the EDR algorithm, but uses a division concept without using the delta concept to indicate the change in signals.13) The first byte of the message compressed by the QRC algorithm is called ‘compression information byte’(CIB), which is the same as the DCC of the EDR algorithm. Periodic signals of 5 bits or more are classified as GE5 signals. State signals of less than 5 bits are classified as L5 signals and multiple L5 signals are grouped.
In the QRC algorithm, the sending and receiving nodes have the divisor of each GE5 signal. The sending node sends the first message without compressing it, divides each GE5 signal by the predefined divisor and stores the quotient. The receiving node also divides each GE5 signal of the received message by the divisor and stores the quotient. The messages are compressed from the second message. For each GE5 signal, the quotient of the signal divided by the predefined divisor is compared with the previously stored quotient and sends the remainder obtained as a result of an operation with the QR bit that is appropriate for the situation.
Fig. 3 shows an example of the message compressed by the QRC algorithm. When the GE5 signal is the same as the previous signal, only the QR bits ‘11’ are sent. For GE5 signals that have been changed, the QR bit is set by comparing with the quotient obtained from the previous signal and the remainder is sent for the predefined remainder bit length of each GE5 signal.
The QRC algorithm allocates a QR bit to every compressed GE5 signal. The QR bit indicates one of the four compression states in Table 1.
2.4 Boundary of Fifteen Compression
The BFC algorithm compresses CAN signals if the current value of the CAN signal is changed within ±15, which is the maximum compression range. The BFC algorithm does not use the first byte of the compressed message to indicate the compression state of the signal, but there is a compression state bit in front of each signal.6)
In the BFC algorithm, signals of 5 bits or less are classified as non-boundary of fifteen(NBF) signals, and signals of 6 bits or more are classified as boundary of fifteen (BF) signals.
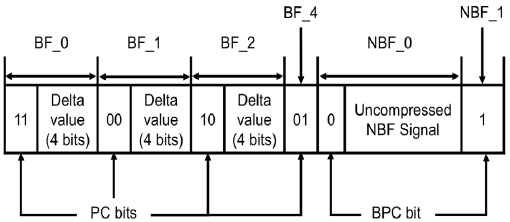
To each NBF signal, one bit called bit parameter compression(BPC) bit is allocated. If the BPC bit is ‘0’, it means that the corresponding NBF signal is not compressed, and the entire NBF signal is sent. If the BPC bit is ‘1’, it means that the NBF signal is fully compressed, and only the BPC bit is sent.
To each BF signal, two bits, which are called parameter compression(PC) bits, are allocated. Four cases of compression according to the PC bit are shown in Table 2.
Fig. 4 shows a sample message compressed by the BFC algorithm. For a BF signal that has been changed within the range of ±15, the difference in value is sent in a length of 4 bits. If the change exceeds this range, the entire BF signal is sent.
2.5 Theoretical Analysis of Compression Algorithms
This DR algorithm compresses data in byte unit, not in signal unit, only when the byte value is the same as the previous value. Therefore, the compression rate may be very low depending on the message signal’s bit arrangement. Since the change amount is not considered, the probability of compressing the message is the lowest.
The EDR, QRC, and BFC algorithms use similar compression methods. Each of these algorithms classify signals of 5~6 bits or more to SDN, GE5, and BF signals, and signals smaller than this as SN, L5, and NBF signals. Since these three algorithms have the same compression method for the SN, L5 and NBF signals, they have the same maximum and minimum numbers of bytes sent as a result of compression for these signals. However, the compression results of the SDN, GE5, and BF signals are different depending on the algorithm.6,13)
While the number of bits sent in the EDR and QRC varies as a result of compression depending on the size of SDN and GE5 signals, the compression result of the BFC is always 4 bits regardless of the size of the BF signal. Therefore, BFC has the highest compression rate for signals of 8 bits or more. However, BFC has a smaller compression range than the EDR and QRC because it compresses the changes in 4 bits only. If the signal values change greatly, the probability of compressing the message is lower than the other two algorithms. In contrast, QRC has a larger compression range compared to EDR and QRC, which simply send the changes. Therefore, QRC has the highest probability of compressing the message among the compression algorithms.
3. Experiment Environment and Result
In order to choose a data algorithm to be applied to vehicles, various data compression algorithms need to be compared in terms of performance. However, it is difficult to compare the data compression algorithms because there is no data compression algorithm adopted as a standard by the in-vehicle network protocol and each algorithm has different CAN bus settings and CAN message configurations.
In this chapter, the algorithms of previous studies are compared in the same environment. The four data compression algorithms described above are applied to a CAN bus, and the maximum bus load and message latency of each CAN bus is measured. The simulation environment and CAN message configurations for the comparative experiments are described, as well as the measurement methods for bus load and message latency. The result shows the maximum bus load and latency of each data compression algorithm. The operation method and performance of each algorithm are analyzed for specific message formats based on the results. The algorithm that has the most efficient message compression performance in automotive environment is presented.
3.1 Experiment Environment
The CAN simulation bus was configured using Vector’s CANoe and the CAN bus load and message latency were measured. The simulation CAN bus is composed of one channel and communicates at a transmission rate of 500 kbps.18) For hardware, Vector’s VN5640 was used. The CAN data compression algorithm was implemented using Vector’s CAPL(Communication Access Programming Language).
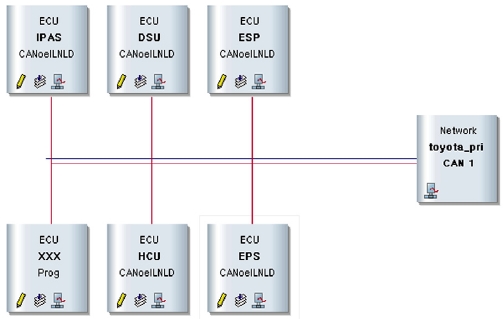
The node and message of the CAN bus were reconfigured based on the CAN database used in Toyota Prius (2010), which was distributed as open source.19) Fig. 5 shows the configuration of the simulation CAN bus in CANoe. It is composed of six nodes and each node exchanges six messages in total.
The CAN messages used in this simulation are LEAD_INFO, BRAKE_MODULE, GEAR_PACKET, PCM_CRUISE_2, STEER_ANGLE_SENSOR, and ACC_CONTROL. Table 3 shows information about the signals sent by each message. The message timings were set randomly because they were missing in the used CAN database. Every message timing was set to 10 ms by default in order to configure an environment similar to an actual vehicle.
3.2 Experiment Method
For the values of message signals, a dataset was composed by saving randomly generated random numbers in a file for each signal. The same experimental data was used for each algorithm experiment. Each message is sent 10,000 times. A feasibility review was conducted by setting various numbers of transmission from 100 to 100,000. It was found that the peak load stabilized from 10,000 or more message transmissions. Considering the experiment time and reliability, 10,000 was set as the experimental method.
The peak load of the bus to which each compression algorithm has been applied and the peak load of each message are determined and compared. The performances of the compression algorithms are then compared according to the message format. In addition, the mean peak load reduction rate of each algorithm is determined by measuring the peak load after increasing the bus load by adjusting the message timing to 7, 5, 3, and 2 ms. To measure the worst-case message latency, the bus load is increased by adjusting the message timing to 1 ms. Then in each CAN bus, the delay of messages with a low priority and the maximum latency are measured and the performances of the algorithms are compared.
3.3 Experiment Results
In the experiment, the peak load is modified by the byte number of the message compressed by the compression algorithm and the bit stuffing of CAN. The peak load is updated when the message is sent with the maximum number of bytes and the maximum bit stuff occurs because the message is not compressed in all message transmission cycles.
Table 4 shows the peak loads of the CAN bus to which the compression algorithm was not applied and the CAN buses to which each algorithm was applied. The existing CAN bus to which the compression algorithm was not applied showed a peak load of 14.55 % in the experimental environment. When the compression algorithms were used, the peak load decreased by up to 35.33 %. The EDR and QRC algorithms showed high reduction rates of 34.98 % and 35.33 %, respectively.
Unlike other algorithms, the DR algorithm compresses data in byte unit, instead of signal unit, and does not compress data unless the value is the same as the previous value. Consequently, it shows a low compression rate when the signal is not made of byte unit and spans between bytes. In Table 4, DR shows similar peak loads for 0×25 and 0×226 messages, but other algorithms show significant differences between them. The 0×25 message is made of 4 bit and 12 bit data, while the 0×226 message is made of 1 bit and 9 bit data. If the message is not compressed because all data of the two messages are different from previous data, the 0×226 message has a smaller number of bytes sent by the two messages for other algorithms. However, DR must send 5 bytes excluding the header bit for both messages if they are not compressed. Thus, there is no difference in compression performance between the two messages, and their peak loads are also similar.
In the case of EDR and QRC algorithms, the QRC has a greater compression range, and thus recorded a lower peak load than that of EDR, but the difference was insignificant.
BFC showed higher peak loads than EDR and QRC in general. BFC showed lower peak loads for 0×127, 0×1D3, and 0×226 messages than those of other messages. These three messages are made of 8 and 9 bit data. When compressing 8 and 9 bit data, EDR has a compression range of ±7 with a total of 6 bits including the 2 header bits and 4 bits indicating the modified amount. However, BFC has a compression range of ±15 with the same 6 bits due to a different operation method, and has an advantage when compressing this type of messages.
Table 5 shows the peak load percentages of the CAN bus according to each message. To examine the peak load reduction rate in an extreme situation, the bus load was increased by arbitrarily reducing the message timing. The peak load decreased by 30.64 % on average when the DR algorithm was used, and by 36.10% when the EDR algorithm was used. In addition, the peak load decreases by 36.36 % on average when the QRC algorithm was used and by 33.74 % when the BFC algorithm was used.
Table 6 shows a comparison of message latency when the message timing is 1ms and the peak load is higher than 90 %. This experiment defined latency as the interval at which messages of the same ID are sent. The 0×2E6 message, which has the second lowest priority in the CAN bus to which compression was not applied, showed a maximum latency of 8.99ms. The 0×343 message of the lowest priority was not sent until all the other messages were sent. When the compression algorithm was applied, the latency decreased, and EDR and QRC showed high reduction rates. Even when a compression algorithm is applied, the first message must be sent as original without compression. Thus, the bus load increased and the 0×343 message of the highest priority was omitted from the first cycle. However, no omission occurred because the compressed message is sent after that, and the latency varied by the performance of the algorithm.
When the times required for compression and decompression of each algorithm were measured, compression and decompression took 0.1μs for DR, whereas it took 0.3μs for EDR, QRC and BFC algorithms, respectively. DR has a time complexity of O(n) and the other three algorithms have a time complexity of O(n2).
4. Conclusions
This study implemented existing CAN data compression algorithms and designed comparative experiments using the CANoe simulation. The peak load and worst-case message latency of the CAN buses to which DR, EDR, QRC, and BFC algorithms were applied were measured and their performances were compared.
- 1) The CAN bus to which the CAN data compression algorithm was applied showed a 32.88 % decrease in peak load when compared with the existing CAN bus. Among them, the QRC algorithm showed the highest peak load reduction rate of 35.23 % on average.
- 2) The message latency was compared by arbitrarily increasing the peak load of the CAN bus with the CAN message timing set to 1 ms. The EDR and QRC showed the largest amount of latency.
- 3) The QRC algorithm showed high performance due to a compression range larger than those of the EDR and BFC algorithms because it compresses data using division.
- 4) The BFC algorithm, similar to the EDR algorithm, determines the difference in values for compression. However, the delta length is fixed at 4 bits unlike the EDR algorithm in which the delta length varies by the length of each signal. Thus, the BFC algorithm shows a higher compression rate than other algorithms, but in the experimental setup, it showed a lower performance compared to EDR and QRC.
Acknowledgments
This work was supported by the Korea Research Foundation with funding from the government (Ministry of Science and ICT) (No. 2020R1G1A1015210).
References
-
B. Jeon, D. Jeong, S. Park and T. Cho, “Development of Intelligent Neutral Coasting Control System for Automatic Transmission Using Adas Technology Convergence,” Transactions of KSAE, Vol.28, No.1, pp.35-42, 2020.
[https://doi.org/10.7467/KSAE.2020.28.1.035]

- T. Kim, S. Lee, M. Choi and D. Lee, “Usability Evaluation of Hmi in Ivi System on Vehicle,” KSAE Fall Conference Proceedings, pp.785-790, 2019.
-
C. Park and S. C. Kee, “Implement of Autonomous Driving System in the Intersection Area Equipped with Traffic Lights,” Transactions of KSAE, Vol.27, No.5, pp.379-387, 2019.
[https://doi.org/10.7467/KSAE.2019.27.5.379]

- C. Oh, “Research for Delay of Can Message Transmission & Improvement of Test Method,” KSAE Annual Conference Proceedings, pp.802-803, 2013.
- T. Kim, B. Cho and J. -Y. Choi, “CAN Bus Monitoring for Improving Vehicle Safety,” KSAE Spring Conference Proceedings, pp.671-672, 2017.
-
S. Kelkar and R. Kamal, “Boundary of Fifteen Compression Algorithm for Controller Area Network Based Automotive Applications,” International Conference on Circuits, Systems, Communication and Information Technology Applications (CSCITA), pp.162-167, 2014.
[https://doi.org/10.1109/CSCITA.2014.6839253]

-
R. Miucic, S. M. Mahumd and Z. Popovic, “An Enhanced Data-reduction Algorithm for Event-triggered Networks,” IEEE Transactions on Vehicular Technology Vol.58, No.6, pp.2663-2678, 2009.
[https://doi.org/10.1109/TVT.2008.2011361]

- D. Song and M. Ryu, “A TTCAN Scheduling Algorithm for Minimizing Worst-case Scheduling Delays of Sporadic Messages,” KSAE Spring Conference Proceeding, pp.846-850, 2009.
- D. Song and M. Ryu. “Scheduling with Optimized Method for Improving Real-time Performance of Ttcan,” Journal of Korea Multimedia Society, pp.733-736, 2008.
-
S. Woo, H. J. Jo, I. S. Kim and D. H. Lee, “A Practical Security Architecture for In-vehicle Can-fd,” IEEE Transactions on Intelligent Transportation Systems, Vol.17, No.8, pp.2248-2261, 2016.
[https://doi.org/10.1109/TITS.2016.2519464]

- J. Lee and S. Lee, “Implementation and Verification of Automotive Can-fd Controller,” Journal of IKEEE, pp.240-243, 2017.
-
S. Misbahuddin, S. M. Mahmud and N. A. Holou, “Development and Performance Analysis of a Data-reduction Algorithm for Automotive Multiplexing,” IEEE Transactions on Vehicular Technology, Vol.50, No.1, pp.162-169, 2001.
[https://doi.org/10.1109/25.917911]

-
S. Kelkar and R. Kamal, “Controller Area Network based Quotient Remainder Compression-algorithm for Automotive Applications,” IECON 2012-38th Annual Conference of the IEEE Industrial Electronics Society, pp.3030-3036, 2012.
[https://doi.org/10.1109/IECON.2012.6389414]

-
P. K. Ramteke and S. M. Mahmud, “An Adaptive Data-Reduction Protocol for the Future In-vehicle Networks,” SAE 2005-01-1540, 2005.
[https://doi.org/10.4271/2005-01-1540]

-
R. Miucic and S. M. Mahmud, “An Improved Adaptive Data-reduction Protocol for In-vehicle Networks,” SAE 2006-01-1327, 2006.
[https://doi.org/10.4271/2006-01-1327]

-
Y. -J. Wu and J. -G. Chung, “Efficient Controller Area Network Data Compression for Automobile Applications,” Frontiers of Information Technology & Electronic Engineering, Vol.16, No.1, pp.70-78, 2015.
[https://doi.org/10.1631/FITEE.1400136]

-
Y. -J Wu and J. -G. Chung, “An Improved Controller Area Network Data-reduction Algorithm for In-vehicle Networks,” IEICE Transactions on Fundamentals of Electronics, Communications and Computer Sciences, pp.346-352, 2017.
[https://doi.org/10.1587/transfun.E100.A.346]

- Vector, CANoe Product Information, https://assets.vector.com/cms/content/products/canoe/canoe/docs/Product%20Informations/CANoe_ProductInformation_EN.pdf, , 2020.
- Github,opendbc-BMW-E8x-E9x, https://github.com/dzid26/opendbc-BMW-E8x-E9x, , 2020.

