실차테스트를 통한 7단 자동변속기용 재제조 토크컨버터의 성능검증 방법에 관한 연구
Copyright Ⓒ 2020 KSAE / 176-07
This is an Open-Access article distributed under the terms of the Creative Commons Attribution Non-Commercial License(http://creativecommons.org/licenses/by-nc/3.0) which permits unrestricted non-commercial use, distribution, and reproduction in any medium provided the original work is properly cited.
Abstract
In this study, to verify the restoration performance of the remanufactured torque converter for seven-speed automatic transmission, bench and real-vehicle tests were performed on the original and remanufactured torque converters. The performance efficiency test of the remanufactured torque converter was carried out in the torque converter test equipment, and the performance efficiency was calculated by the speed ratio and torque ratio calculated from the measured values of the rotational speeds and torques of the input and output shafts of the torque converter. In the actual vehicle, the transmission response characteristics test, P-R-N-D response characteristics test, and automatic-transmission stall test were performed, and vehicle tests were performed after the installation of the original and remanufactured torque converters, respectively. The comparison of the results of the bench and vehicle tests for the original and remanufactured torque converters revealed that the performance of the remanufactured torque converter was restored to a level equivalent to that of the original torque converter.
Keywords:
Torque converter, Automatic transmission, Remanufacturing, Performance restoration, Performance efficiency test, Vehicle test키워드:
토크컨버터, 자동변속기, 재제조, 성능 복원, 성능 효율 테스트, 실차테스트1. 서 론
현대 사회가 직면한 자원의 유한성에 따라 에너지원의 고갈, 환경오염 등의 문제를 해결할 수 있는 유일한 대안으로서 제시되고 있는 자원순환의 한 방법인 재제조는 사용한 제품을 체계적으로 회수하여 특수한 기술적 요소인 분해, 세척, 검사, 보수・조정, 재조립, 최종검사 등 일련의 공정과정을 거쳐 원래의 성능으로 복원하는 것을 말한다. 특히, 재제조 기술개발을 통해 생산된 재제조 제품은 신품과 유사 또는 동등한 수준의 품질이며 신품 가격의 30 ~ 50 %로 시장에 공급이 가능하여 활발한 연구가 진행되고 있다.
전 세계적으로 가장 활성화되어 있는 재제조 대상은 자동차 부품이며, 자동차 산업에서는 재제조된 자동차 부품을 공급함으로써 순정부품의 공급한계를 극복할 수 있어 각 구성 부품에 대한 재제조 연구가 활발하다.1,2)
본 연구에서는 자동차 부품 중 고부가 가치를 갖는 자동변속기의 핵심 부품인 토크컨버터(Torque converter)를 연구 대상으로 선정하였다. 토크컨버터는 엔진으로부터 발생한 동력을 변속기에 전달하는 장치로서 토크 증배, 연속 변속 및 정지시 엔진 시동 꺼짐 방지 등의 기능을 수행하는 등 자동변속기에서 가장 중요한 역할을 수행하는 부품이다.3)
연구 방법은 토크컨버터 재제조 제품과 신품에 대하여 성능을 비교 평가함으로써 성능 복원률을 확인하였고 성능 평가 방법은 단품에 대한 성능 효율 평가와 실차 평가를 수행하였다. 실차 평가에서는 계측 장비인 eDAQ 및 CAN DB를 이용하여 차량의 속도, 기어단, 기어 변속단의 위치, 엔진 RPM, 엔진 토크 등의 데이터를 측정하여 차량의 거동 및 변속 패턴을 확인하였고 이를 통해 변속 응답성, P-R-N-D 변속 응답성, 스톨 테스트(Stall test)를 수행하였다.
2. 토크컨버터 재제조기술
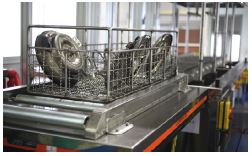
사용 후 제품・부품에 대한 재제조 공정은 일반적으로 코어 수집, 분해, 세척, 검사, 보수・조정, 재조립, 최종검사 등 일련의 과정을 거쳐 원래의 성능으로 복원되어 생산되는 형태이다. 재제조 공정 중 보수・조정공정에서 수행되는 성능 복원 기술은 대상 제품이 가진 기능/구조적 특성에 따라 개발되어 적용되고 있다.4,5)
7단 자동변속기용 토크컨버터의 경우, 크게 세 부위에 대한 성능 복원 기술이 개발되어 적용되고 있으며 이는 댐퍼 클러치(Damper clutch) 피스톤 가이드(Piston guide), 댐퍼 클러치 접합면, 임펠러 허브(Impellar hub) 등이다.
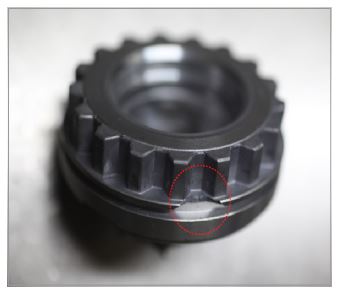
댐퍼 클러치 피스톤 가이드는 프론트 커버(Front cover)에 압입되는 부품으로서 피스톤 플레이트(Piston plate)의 내측 기어와 조립되는 구조이며 피스톤 플레이트가 좌・우로 이동할 때에 가이드 역할을 수행한다. 피스톤 가이드가 파손되면 록업 클러치(Lockup clutch)의 비정상 작동을 유발하는데 대표적인 파손 형태는 Photo. 1과 같다.
피스톤 가이드의 성능 복원 방법은 파손된 피스톤가이드의 중앙 홀 부위를 드릴로 가공하여 프론트 커버로부터 제거한 후 전용 압입기를 사용하여 프론트 커버에 신품 피스톤 가이드를 특정 압력으로 압입하는 방식을 적용하였다.
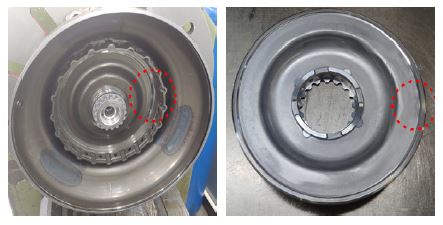
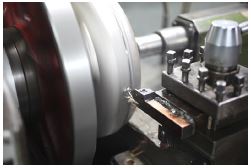
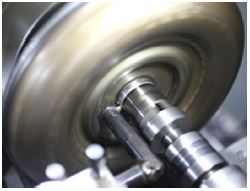
댐퍼 클러치 접합면은 Photo. 2와 같이 프론트 커버 내측의 면으로서 피스톤 플레이트의 돌기에 형성된 홈이 접촉하는 부위이다. 댐퍼 클러치 접합면의 복원 방법으로서 피스톤 플레이트의 작동 원활성을 확보하기 위해 반경 방향 약 4 mm에 해당하는 접촉부위를 절삭 깊이 약 0.25 mm만큼 가공하는 공정을 적용하였다.
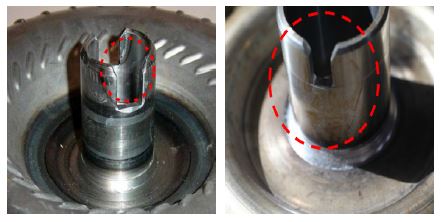
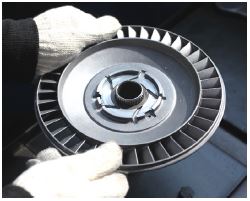
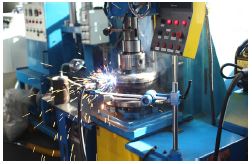
토크컨버터의 임펠러 허브는 임펠러 하우징(Impellar housing)에 용접되어 있는 부품으로서 오일펌프와 토크컨버터 조립 시, 임펠러 허브의 슬롯이 오일펌프 드라이브 기어(Drive gear)의 내측에 있는 2개의 키와 조립되어 엔진으로부터 발생한 회전력이 토크컨버터를 거쳐 오일펌프가 구동될 수 있도록 한다. 따라서 엔진 회전력의 급속한 변화 또는 유압 장치에 과도한 부하가 인가되면 임펠러 허브의 슬롯 부위가 파손되는 경우가 발생한다. 임펠러 허브의 복원 방법은 파손된 임펠러 허브를 임펠러 하우징으로부터 절단하여 Photo. 3과 같이 신품 임펠러 허브로 교체하였으며 용접 방법으로서 CO2 용접을 적용하였다.
Table 1은 토크컨버터 재제조 공정에 대한 표로서 코어 수집부터 최종 검사까지의 각 공정을 단계적으로 제시한 것이다.
3. 토크컨버터 성능 효율 테스트
본 절에서는 7단 자동변속기용 토크컨버터 신품과 재제조 제품에 대한 최대 성능 효율을 측정하여 비교 평가함으로써 신품의 최대 성능 효율 대비 재제조 제품의 최대 성능 효율을 산출하여 재제조를 통한 성능 복원 정도를 확인하였다.
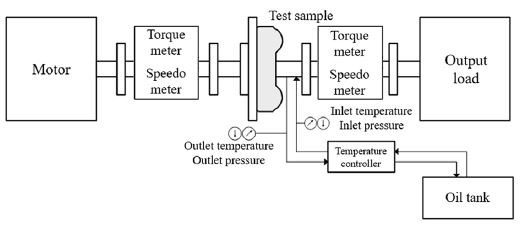
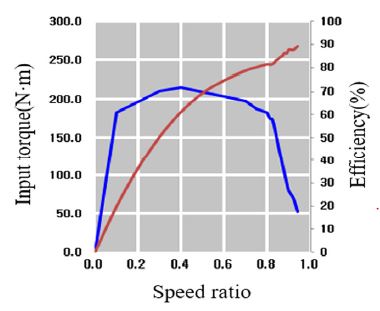
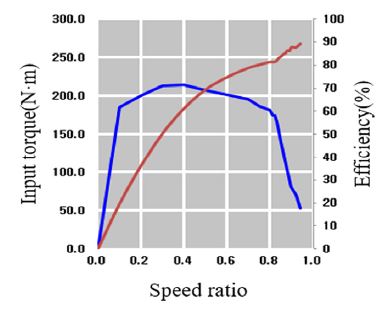
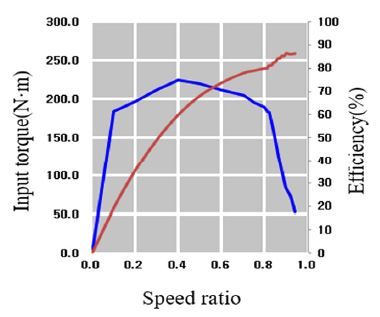
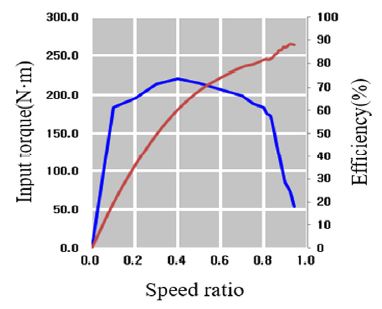
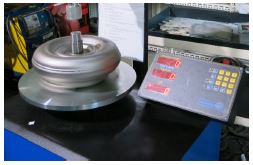
토크컨버터 신품 및 재제조 제품에 대한 성능 효율 시험은 Fig. 1과 같은 전용 시험 장비로부터 입・출력 회전수 및 토크를 측정하고 아래 식에 적용하여 속도비(e), 토크비(t), 전달효율(η)을 산출하였다.
| (1) |
| (2) |
| (3) |
where Tb : ouput torque (N・m)
TP : input torque (N・m)
Nb : output RPM (r/min)
NP : intput RPM (r/min)
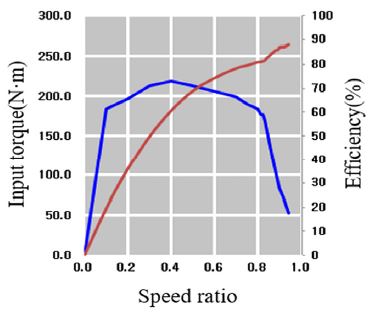
토크컨버터 신품 성능 효율 시험 결과는 Table 2와 Fig. 2, Fig. 3과 같으며 시험 결과에 따르면 신품 토크컨버터 시료 2개 모두 속도비는 0.8, 토크비는 1.02로 측정되었고 최대 성능 효율은 각각 81.28 %, 81.19 %로 산출되었다.
토크컨버터 재제조 제품 성능 효율 시험 결과는 Table 3과 Fig. 4, Fig. 5, Fig. 6과 같으며 시험 결과에 따르면 재제조 제품 토크컨버터 속도비는 각각 0.80, 0.81, 0.81, 토크비는 각각 1.00, 1.01, 1.00으로 측정되었고 최대 성능 효율은 각각 79.83 %, 81.83 %, 80.97 %로 산출되었다.
Table 4는 신품 대비 재제조 토크컨버터의 성능 효율 산출 결과이다. 산출 방법은 신품의 최대 성능 효율 평균값과 재제조 제품의 최대 성능 효율 평균값을 비교하였으며 99.57 %로 산출되었다.
4. 토크컨버터 실차 테스트
토크컨버터 신품과 재제조 제품을 실제 차량에 적용하여 비교 평가하기 위해 Table 5와 같이 테스트 시스템을 구성하고 변속 응답성 테스트, P-R-N-D 변속 응답성 테스트, 스톨 테스트를 수행하였다.
4.1 실차 테스트 시스템 구성
7단 자동변속기용 토크컨버터 신품과 재제조 제품에 대한 성능을 비교 평가하기 위해 실험 차량은 7단 자동변속기가 적용된 차량을 선정하였으며 동일 차량의 자동변속기에 토크컨버터 신품과 재제조 제품을 교체하여 수행하였다. 각각의 테스트 항목은 한국자동차연구원이 운용하는 주행시험장(Proving Ground, 이하 PG)의 범용로 및 풍세면 일원의 국도에서 수행하였다.
4.2 변속 응답성 평가
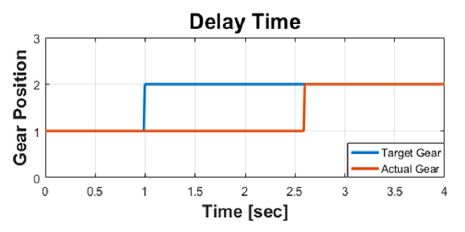
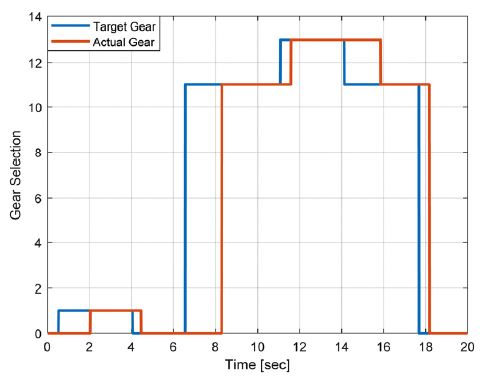
변속 응답성이란 차량의 CAN 데이터 중 TCU로부터 발생하는 타겟 기어(Target gear)의 단수가 변경된 시점부터 액츄어 기어(Actual gear) 단수로 변화된 시간의 차이를 의미한다.
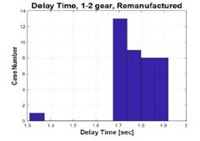
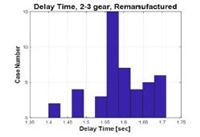
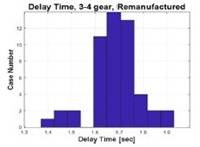
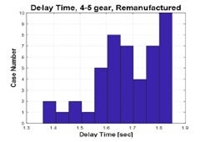
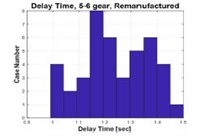
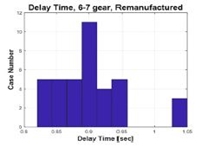
Fig. 7에 기어 변속간 응답성 측정 방법의 예를 도시하였다. 변속 응답성 평가 구간은 1단-2단, 2단-3단, 3단-4단, 4단-5단, 5단-6단, 6단-7단 등 총 6개 구간이며 각 구간별 반복적으로 수집되어 분석되는 테스트 횟수는 신품과 재제조 제품 모두 최소 38회 이상으로 설정하였다.
7단 자동변속기용 토크컨버터 신품과 재제조 제품에 대한 변속 응답성 평가 결과는 다음과 같다.
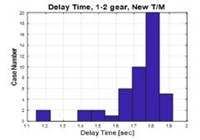
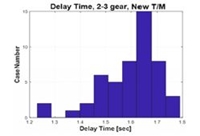
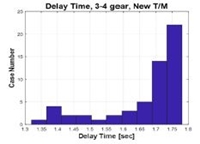
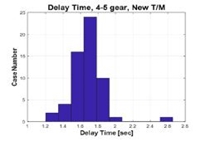
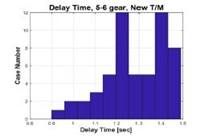
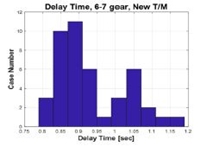
각 단수별 기어 변속에 대하여 평균 응답 시간 측정 결과, 신품 대비 재제조 제품의 변속 응답 성능은 1-2단 구간에서 97 %, 2-3단, 4-5단 구간에서 100 %, 3-4단 구간에서 99 %, 5-6단, 6-7단 구간에서 104 %로 산출되었다. 신품 응답성의 최소 반응값을 보인 구간은 6단-7단 구간이며 0.94초로 측정되었고 최대 반응값은 1단-2단 구간으로서 1.72초였다. 전 구간 변속 평균 응답성 시간은 0.94초∼1.72초로 측정되었다. 재제조 제품 응답성의 최소 반응값을 보인 구간은 6단-7단 구간이며 0.90초로 측정되었고 최대 반응값은 1단-2단 구간으로서 1.77초였다. 전 구간 변속 평균 응답성 시간은 0.90초∼1.77초로 측정되었다.
4.3 P-R-N-D 변속 응답성 평가
1단부터 7단까지의 변속 응답성 평가 외에도 주차 모드(Parking, 이하 P), 후진 모드(Reverse, 이하 R), 중립 모드(Neutral, 이하 N), 주행 모드(Drive, 이하 D) 등의 변속 모드에 대한 응답성 평가를 수행하였다. 평가 방법은 정차 중 실험 차량의 기어를 N에서 시작하여 D→N→R→P→R→N의 순서대로 변속하고 기어 변속이 완료되는 시점까지 걸리는 시간을 측정하는 과정으로 설정하였다. 해당 시험은 10회 반복하여 데이터를 도출하였다.
7단 자동변속기용 토크컨버터 신품과 재제조 제품에 대한 P-R-N-D 변속 응답성 평가 결과는 다음과 같다.

The P-R-N-D shift response characteristics values of the remanufactured product compared to original product
P-R-N-D 기어 변속 응답성 평균 시간 측정 결과, 신품 대비 재제조 제품의 변속 응답 성능은 P-R단, N-D단, N-R단 구간에서 100 %, R-N단 구간에서 106 %, D-N단 구간에서 93 %, R-P단 구간에서 104 %로 산출되었다. 신품 응답성의 최소 반응값을 보인 구간은 N-D 구간이며 응답 시간은 0.39초로 측정되었고 최대 반응값은 R-P 구간으로서 1.74초였다. 전 구간 변속 응답성 평균 시간은 0.39초∼1.74초로 측정되었다. 재제조 제품 응답성의 최소 반응값을 보인 구간은 N-D 구간이며 0.39초로 측정되었고 최대 반응값은 R-P 구간으로서 1.67초였다. 전 구간 변속 응답성 평균 시간은 0.39초∼1.67 초로 측정되었다.
4.4 스톨 테스트
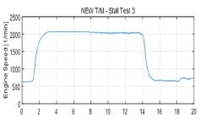
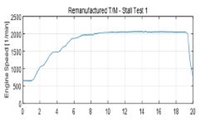
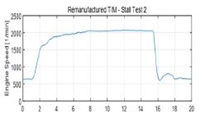
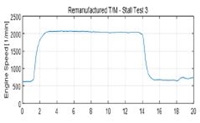
토크컨버터 신품과 재제조 제품의 실차 평가 항목 중 변속 클러치가 슬립없이 최대 엔진토크를 홀드할 수 있는지 확인하기 위한 스톨 테스트를 수행하였다. 스톨 테스트의 시험 방법은 다음과 같다.
- 1) 실험 차량의 OBD 단자에서 ECU의 CAN 단자를 측정 장비(eDAQ)와 연결하고 차량의 CAN 통신으로부터 엔진 RPM, T/M 온도, 타겟 기어, 액츄어 기어 등을 설정한다.
- 2) 실험 대상 차량은 약 30분간 주행 후 엔진오일 온도와 자동변속기 오일의 온도가(70 °C 이상) 정상 상태를 유지해야 하며, 전조등을 켜고 에어컨을 3단으로 작동한다.
- 3) 자동변속기의 오일 점검을 실시하여 부족 시 보충을 실시하며, 주차 브레이크 작동 및 각각의 타이어에 고임목 설치, 엔진 시동 후 브레이크 페달을 밟고 D 위치로 변속 레버를 이동시킨다.
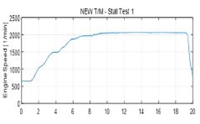
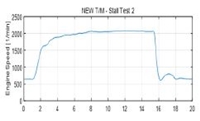
- 4) 가속 페달을 6초동안 끝까지 밟은 상태에서 엔진 최대 회전수를 측정한다.
- 5) 해당 평가는 3회 반복하여 측정하며, 반복 측정시 N 위치에서 최소 2~3분간 대기 후 다음 순서로 진행한다.
7단 자동변속기용 토크컨버터 신품과 재제조 제품에 대한 스톨 테스트 결과는 다음과 같다.
스톨 테스트 결과, 신품 토크컨버터가 장착된 차량의 최대 평균 엔진 회전수는 2,075 r/min, 재제조 제품은 2,099 r/min으로 측정되었다.
5. 결 론
본 연구에서는 재제조 토크컨버터의 성능 복원을 검증하기 위해 성능 효율 테스트와 실차 테스트를 수행하여 이를 신품과 비교 평가하였으며 다음과 같은 결론을 얻었다.
- 1) 토크컨버터 신품과 재제조 제품에 대한 성능 효율을 비교 평가함으로써 사용 후 토크컨버터에 대하여 재제조를 적용하면 신품과 동급의 성능으로 복원됨을 확인하였다.
- 2) 토크컨버터 신품과 재제조 제품에 대한 변속 응답성 평가 결과, 4개 구간에서 신품 대비 100 % 또는 100 % 이상, 2개 구간에서 신품 대비 97 % 이상의 값으로 측정됨에 따라 복원된 변속 응답 성능이 신품과 유사함을 확인하였다.
- 3) 토크컨버터 신품과 재제조 제품에 대한 P-R-N-D 변속 응답성 평가 결과, 5개 구간에서 신품 대비 100 % 또는 100 % 이상, 1개 구간에서 신품 대비 93 % 이상의 값으로 측정됨에 따라 변속 응답성과 같이 신품과 유사한 성능으로 복원되었음을 확인하였다.
- 4) 토크컨버터 신품과 재제조 제품에 대한 스톨 테스트 측정 결과, 재제조 제품의 최대 엔진 회전수는 신품 과 동등한 성능값으로 측정됨에 따라 슬립되는 정도가 신품과 큰 차이가 없음을 확인하였다.
- 5) 재제조 제품에 대한 품질을 확보하여 기술 경쟁력을 강화하기 위해서는 성능 테스트를 거쳐야 하며 성능 평가 과정은 벤치 테스트와 실제 차량에 장착하여 수행하는 실차 테스트를 모두 수행한다면 품질 평가에 대한 신뢰성을 높일 수 있을 것으로 사료된다.
Nomenclature
| e : | speed ratio |
| t : | torque ratio |
| η : | efficiency |
| Nb : | output shaft rotating speed, r/min |
| Np : | input shaft rotating speed, r/min |
| Tb : | output shaft torque, N・m |
| Tp : | input shaft torque, N・m |
Subscripts
| CAN : | controller area network |
| ECU : | electronic control unit |
| eDAQ : | electronic data acqusition systems |
| OBD : | on board diagnostics |
| RPM : | revolution per minute |
| T/M : | transmission |
Acknowledgments
본 연구는 산업통상자원부(MOTIE) 에너지자원순환기술개발사업(20175010300860)의 지원을 받아 수행된 연구입니다.
References
- J. Y. Yi, “Resource Circular Social Problem of the Quality Certification System for Remanufactured Product,” Korean Environmental Law Association, Vol.41, No.2, pp.173-210, 2019.
- C. W. Nam, H. K. Lee, H. J. Kim, R. M. Kim, H. S. Song, C. S. Ha and C. K. Kang, “A Study of Failure Analysis of used Common Rail Diesel Engine and Performance Comparison Remanufactured Engine,” KSAE Spring Conference Proceedings, pp.1048-1054, 2015.
-
J. D. Jang, W. C. Lee and D. H. Sung, “A Ballooning Phenomenon of Torque Converter Torus Size for Automatic Transmissions,” Transactions of KSAE, Vol.24, No.6, pp.702-708, 2016.
[https://doi.org/10.7467/KSAE.2016.24.6.702]

- H. Y. Kang and Y. C. Kim, “Current Status and Trend of Koreas Remanufacturing R&D in the Field of Automotive Parts,” Auto Journal, KSAE, Vol.35, No.12, pp.20-24, 2013.
-
Y. K. Seo, D. H. Jung, S. S. Yu and W. Y. Rha, “The Optimization Study on the Test Method of Remanufactured Power Steering Oil Pump by Using FMEA,” Transactions of KSAE, Vol.24, No.1, pp.90-98, 2016.
[https://doi.org/10.7467/KSAE.2016.24.1.090]


