A Study on the Analysis of the Technology of Hydrogen Fuel Cell Vehicle Parts : With Focus on the Patent Analysis of Co-Assignees
Copyright Ⓒ 2020 KSAE / 172-08
This is an Open-Access article distributed under the terms of the Creative Commons Attribution Non-Commercial License(http://creativecommons.org/licenses/by-nc/3.0) which permits unrestricted non-commercial use, distribution, and reproduction in any medium provided the original work is properly cited.
Abstract
This paper presents a technology analysis and development strategy through patent analysis for companies related to hydrogen fuel cell automobile parts in South Korea and Japan. Based on the patents of Hyundai, Toyota, and Honda, which have a history of mass production of hydrogen fuel cell vehicles, an overall technology classification system for hydrogen fuel cell vehicles and various patent analysis indicators were established.
Keywords:
FCEV, Fuel cell electric vehicle, Patent analysis, Intellectual property, R&D strategy1. Introduction
Humankind today is faced with problems like the global warming phenomenon caused by increased temperatures due to the increase in the energy remaining in the atmosphere due to the rapid CO2 emissions from the excessive use of fossil fuels, and the environmental problems caused by the destruction of the ozone layer. To solve these problems, there is a growing interest in renewable energy worldwide.1,2)
Among the different types of renewable energy, solar energy has a low energy density, thereby requiring a large area to obtain a certain amount of energy, and wind and hydro power can be obtained only in regions where wind and water are abundant, creating regional limitations. Hydrogen energy, however, can be easily converted into electric energy using the fuel cell technology, giving it the advantages of transportation or storage capability by converting it into gas or liquid, and of the production capability of an unlimited amount of energy from water or organic matter as an energy medium. In addition, while fossil energy can make a country an energy superpower depending on the amount of its underground fossil energy reserves, hydrogen energy, which can become a new source of energy for making human industrial activities convenient, can make any country an energy power depending on the country’s efforts to develop a hydrogen energy technology. For these reasons, major developed countries are investing efforts and resources to conquer the fast-growing hydrogen energy markets ahead of other countries. In particular, there has been a growing interest of late in “hydrogen fuel cells” that can accommodate the existing fossil-fuel-based energy systems without a great impact.2)
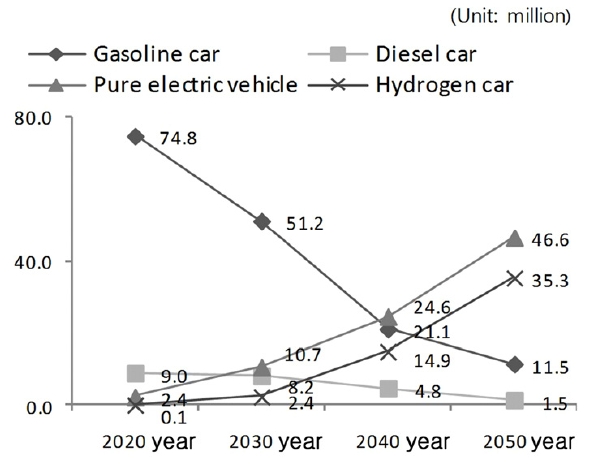
Fuel cell electric vehicles(FECVs) use electric energy generated by reacting hydrogen with the oxygen in the air as fuel, so they are more environment-friendly than the internalcombustion-engine cars, have higher energy conversion efficiency than the diesel engine, and can travel 300 ~ 600 km with one-time charging. They are also differentiated from Electric vehicles(EVs) in that they generate electricity by themselves as the next-generation cars.3)
For a new product to be commercialized, however, it should meet the conditions of price, quality, and purchase. FCEVs have difficulty being commercialized due to relatively high prices and problems with stability and infrastructure.4) This study presented a technology analysis and development strategy through an analysis of the patents of companies related to FCEV parts in South Korea and Japan.22) Towards this end, based on the patents of companies with a history of mass production of FCEVs(Hyundai, Toyota, Honda, etc.), an overall technology classification system of FCEVs was established, and various patent analysis indicators were used to analyze the competitiveness of individual technologies and to present relevant parts companies. The findings of this study are expected to help relevant South Korean companies establish roadmaps and technology development strategies for developing FCEVs.
2. Theoretical Background and Hypotheses
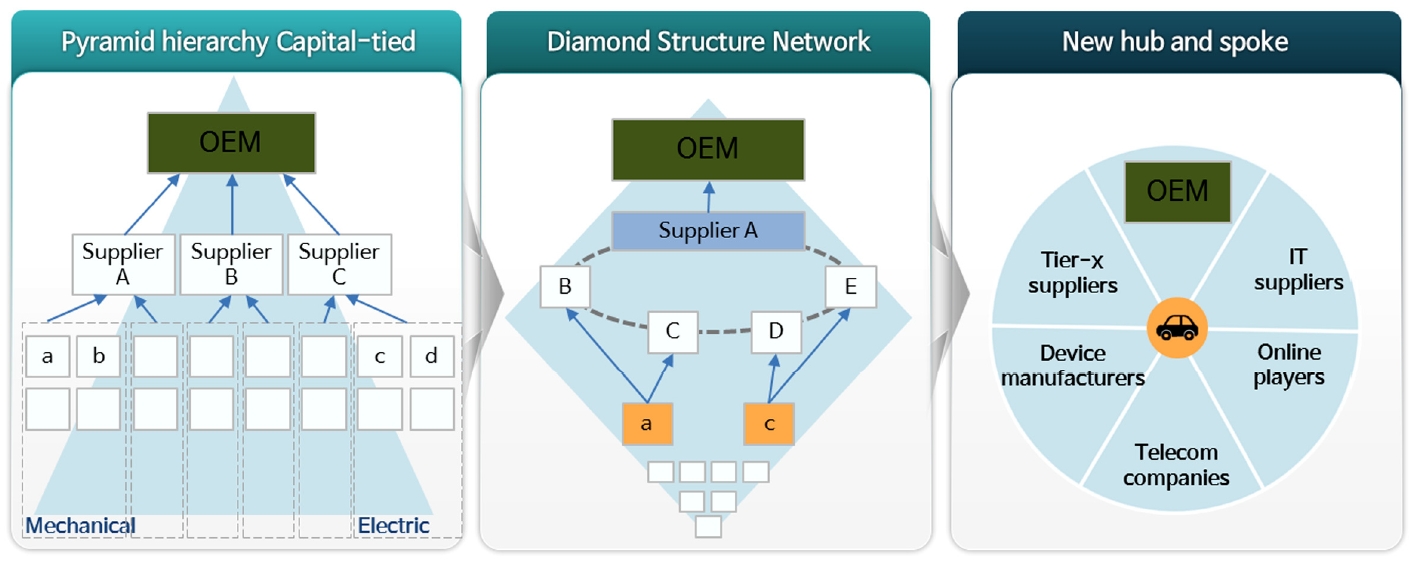
As the automobile industry is increasingly adopting ICT and as the self-driving technology is spreading, the automobile industry’s pyramid structure, in which automakers monopolize the leadership, is shifting to a diamond or network type, in which the leadership is distributed to many companies.5) The existing value chain of the automotive industry is also shifting from the pyramid structure with the OEMs at the top to the diamond structure, which is expected to shift to the hub-and-spoke structure in the future.6)
Eco-friendly cars play a pivotal role in the paradigm shift that is currently occurring in the automotive industry, and their importance is increasing as the concerns about environmental issues rise. In the current Fourth Industrial Revolution era, the automotive industry’s paradigm shift is headed towards two trends: self-driving vehicle technologies geared towards safety and convenience, and eco-friendly cars focused on emission reduction. Eco-friendly cars are accelerating the expansion of technology development and commercialization, and are becoming a core technology of the automobile industry. FCEVs require not only car body and parts technologies like the internal combustion engine technology but also a full-cycle linkage of various elements for operation, such as hydrogen production, storage, and transport. To secure total eco-friendliness for FCEVs, it is necessary to advance the upgrading of related technologies, including the reforming process for hydrogen production, from a full-cycle perspective. In addition, it is necessary to continuously implement measures for enhancing market acceptance, to utilize external resources through open innovation aimed at reducing the cost of innovation, and to increase the possibility of success to maximize the creation of added value. According to Chesbrough, companies are increasingly expanding their open innovation because there has been a change in the knowledge landscape surrounding companies. Throughout the 20th century, a series of changes in the knowledge environment have made open innovation essential, which can be summarized into three changes: (1) the end of the monopoly of knowledge by large corporations; (2) increased workforce liquidity and development of venture capital; and (3) increased technology development costs and shortened product cycles. If the process of research/development/ commercialization is completely done within a single company, this method is called “closed innovation.” Meanwhile, open innovation can facilitate the exchange of knowledge between the inside and outside of a company at each stage, so that external technologies can be introduced into the company, and conversely, the technology inside the company can be commercialized through other external channels.
The purpose of the network analysis method that was used in this study is to find and interpret the patterns of the networks,18) and as such, three indices - degree centrality, closeness centrality, and betweenness centrality - were used.
Order centrality is a statistical indicator of whether a company in the network is directly connected to other companies. The degree to which firm v of n firms is connected to other firms is calculated based on deg (v), and it can be expressed as CD (v), as shown in equation (1).
| (1) |
Degree centrality considers statistics only by connection, so it plays an analysis role only within a local scope. In this study, the direction of In-Degree and Out-Degree was not considered. Only the cooperative relationship was confirmed.
Closeness centrality is a statistical index indicating centrality considering not only direct connection but also indirect connection. It shows how closely a company is located in the virtual space with other companies, and it can be expressed as Cc (Pk), as shown in equation (2), when there are firms Pi and Pk among n firms. In equation (2), d(Pi, Pk) is the shortest distance between nodes i and k, and n is the total number of firms.
| (2) |
If the virtual distance between all the nodes connected to the other nodes is calculated, it will determine the global centrality of the relevant network. In other words, if the closeness centrality is increased, it becomes easier to access and secure the influence, status, and information power in the network.
Betweenness centrality is a statistical index that indicates whether the node plays the role of a broker well.
| (3) |
In equation (3), δst is the shortest path count between nodes s and t, and δst(υ) is the number of paths passing through node v among the shortest paths. Betweenness centrality expresses how much a node contributes to the interconnection of the nodes, and it is deemed that a large betweenness centrality can greatly influence the communication flow in the network.
In this study, through an analysis of the patents of Hyundai, Toyota, and Honda, which have a history of mass production of FCEVs, an overall technology tree of FCEVs was established, and competitiveness analysis data by detailed technology and related parts company were derived through various patent analysis indices. While it cannot be claimed that patent indicators directly represent a company's R&D performance, many previous studies showed that the key indicators of patents as a measure of R&D activity can represent a certain R&D activity level, as evidenced in quantitative empirical studies on the relationships between R&D activities and the market changes at the levels of patents and corporations.7-9)
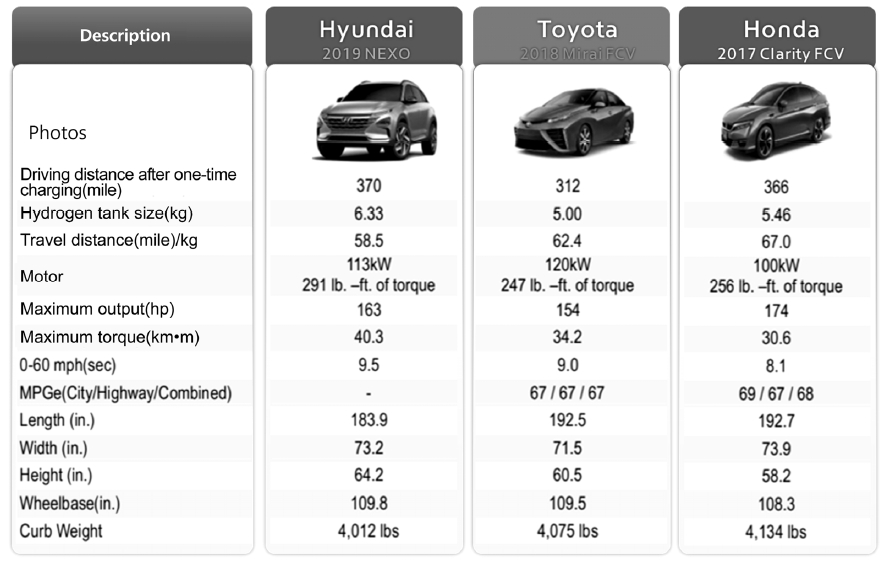
The following hypotheses were set after the analysis of the previous studies revealed that the patent activity and patent quality performance were boosted as a result of measuring them by sales growth and sales per person, and that holders of good-quality patents are more successful than holders of low-quality patents10, and after the analysis of the hardware specifications of the three target companies in this study.
H1. It is assumed that Japanese companies have a higherlevel FCEV technology.
Exerting efforts to analyze and evaluate the potential and growth possibility of a few or individual patents, researches are currently moving to use massive biological data in adopting more precise analysis methodologies. This can offer a more reliable macroscopic view for examining the internal/external linkage structure of technology.11) The network analysis used herein is a suitable methodology for defining the complicated interconnection structure of certain entities or technologies. In addition, the resulting indices can be used to identify the influence and connection between networks. In particular, the recently developed network analysis methodology is being used in studies designed to identify networks.12,13) From the perspective of technology and knowledge, it offers a significant implication to corporations’ knowledge linkage, their relative position, and the changes therein.
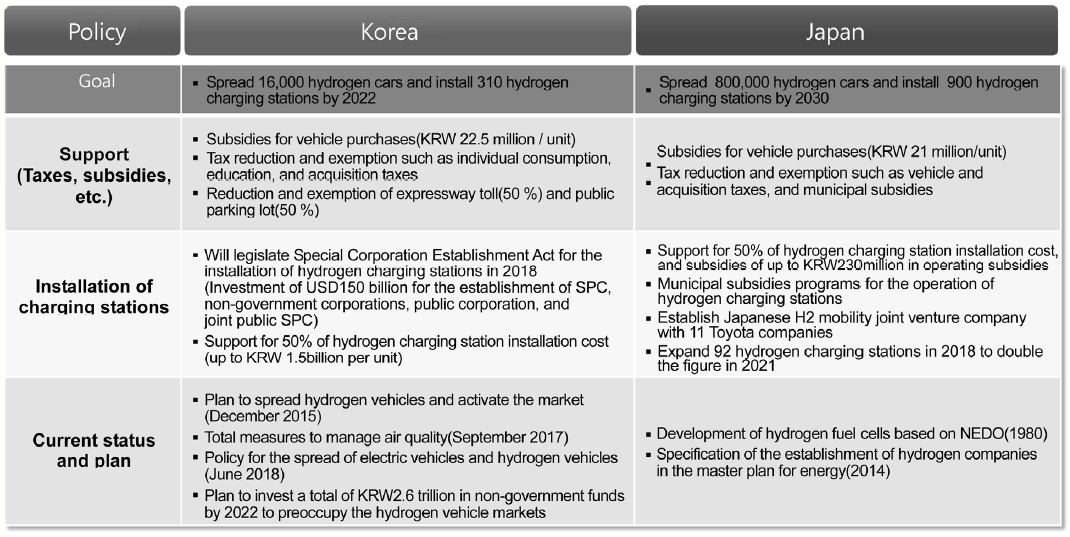
H2. It is assumed that Japanese companies have a higher level of cooperation in the development of FCEVs.
3. Analysis
3.1 Analysis Method
To verify the aforementioned study hypotheses, in the patent DB (Wisdomain) containing data obtained from March 30, 1999 to April 1, 2019, the raw patent data of three companies with a history of mass production of FCEVs were used in analyzing joint patent applicants. The population for sampling was taken from the patents that had been filed in such companies’ respective countries, because they first applied for patent filing in their respective countries. Motors and the joint applicant are implied behind the naming of the three companies in the table. Technology classification was accomplished after the 1st-phase main IPC-based technology classification, the 2nd-phase three subclass combinations, the 3rd-phase reclassification by invention name, and the 4th-phase reexamination by applicant. For the quantitative and qualitative analyses of the patents, patent indicators were used, and for the network analysis, the network analysis index was calculated using Gephi 0.9.2. When establishing the tech tree, the functions and detailed technologies were classified based on Chungnam Science and Technology Roadmap(2017), and the technology classification, as deemed necessary in the process of classification, was added (see Appendix).
3.2 Quantity Aspect
In terms of patent count, of the three companies, Toyota was superior in most of the areas, and Honda had a larger number of patents because it developed multiple electronic valves in hydrogen storage systems jointly with Keihin.
The patent activity index (AI) is the ratio of a research entity’s total patent count in a certain technology area.14,15) If AI is greater than 1, the patent concentration is high, and the AI values can be compared by year. In a broader coverage of data, the AI values of competitors in the same period can be compared to identify their AI in relevant areas. Toyota had a higher AI in A (fuel cell systems), and Honda had a higher AI in C (hydrogen storage systems). Hyundai had a higher AI in B (power conversion and electric drive systems) and in D (control technology).
3.3 Quality Aspect
The cites per patent (CPP) is normally not measured for patents filed within the last 3 years because CPP should be smaller in that case.16) With the exclusion of the patents filed within the last 3 years, CPP was calculated, revealing that Toyota had a higher CPP in all the areas (A, B, C, and D) while Hyundai had a higher CPP in areas E and F.
The patent impact index (PII) is an index reflecting the past technical activities before a certain point, and the relative technological superiority of a patent holder can be confirmed using the patent count and CPP. A PII of 1 points to an average cite frequency while a PII of 2 means that the patent was cited twice more than the average. Toyota’s PII for 37 patent cases of power conversion and electric drive systems was higher while Hyundai had a higher PII in production technology.
The technology quality index was calculated by giving weights to CPP, which is designed to evaluate the quality while the patent count is designed to evaluate the quantity. In terms of quantity, there was a big difference between Toyota and Hyundai, but Hyundai was proven to be superior in terms of technology strength in the last 5 years. Toyota had an 18% examination claim rate and was found to determine whether to claim examination after sufficiently utilizing the 3-year period. Such patent policy is deemed to be a bid to ensure cost efficiency through the clear setting of the rights scope and the selective acquisition of rights.
A big patent family size(PFS) means high market power.17 Hyundai filed patent applications in Japan only for A(fuel cell systems) while filing patent applications for other technologies in four countries(US, DE, CN, KR). Toyota filed less patent applications in South Korea and filed more patent applications in 11 other countries(JP, US, DE, CN, KR, CA, EP, GB, FR, AU, HK). Honda filed applications for important patents in five countries(JP, US, DE, CN, KR).
3.4 Network Analysis (SNA)
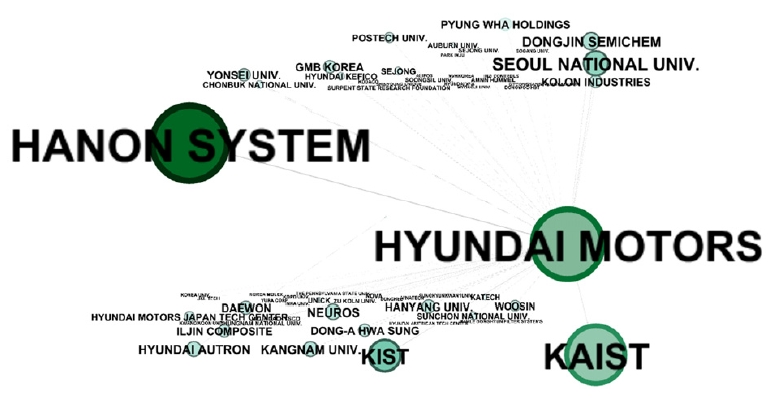
Hyundai filed 60 joint patent applications and 233 FCEV patent applications. It had 47 joint patent applications concentrated in the area of fuel cell systems (A), and had a high cooperation index with KIST, KAIST, and Hanon System. In addition, it had a high cooperation index with Iljin Composites Co. in the area of hydrogen storage systems (C).
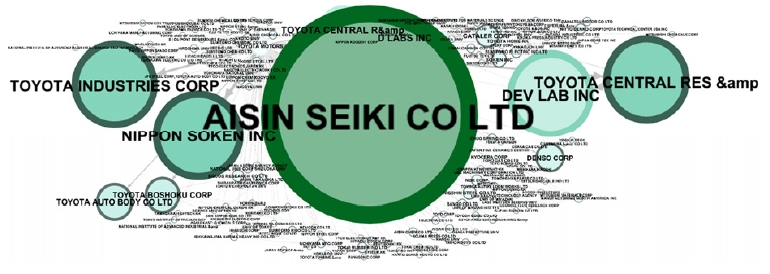
Toyota filed 190 joint patent applications and 1,987 FCEV patent applications. It had 145 joint patent applications concentrated in the area of fuel cell systems (A), and had a high cooperation index with Aisin Seiki Co. Ltd., Nippon Soken, Toyota Central R&D Labs, Toyota Industries Corp., etc.
Honda filed 33 joint patent applications and 201 FCEV patent applications. It had 22 joint patent applications concentrated in the area of fuel cell systems (A), and had a high cooperation index with JSR Corp., Keihin Corp., Tanaka Kikinzoku Kogyo KK, etc.
An analysis of degree centrality revealed that a majority of the joint research projects were conducted jointly with OEMs based on a 50:50 ratio. In terms of the analysis of closeness centrality, Toyota had a higher cooperation level than the other companies. In terms of the analysis of betweenness centrality, Toyota’s joint patent applications served well as the research intermediary.
4. Conclusion
4.1 Study Results and Implications
This study sought to derive the implications of the technology strength(H1) and technology cooperation(H2) of fuel cell electric vehicles(FCEVs) through the analysis of the joint patent applications of South Korean and Japanese automobile corporations. The findings of this study and a proposal for the future improvement of the FCEV technology are shown below.
H1. The quantitative and qualitative analyses of the FCEV technology revealed that the superior technology by technology area was different among the companies. A more detailed quantitative analysis found that the Japanese companies led the way, but the qualitative analysis confirmed that there were technologies in which the South Korean companies led the way (technology areas B and D); thus, the hypothesis was rejected. |
H2. In terms of technology cooperation for the development of FCEVs, the analysis of networks revealed that Toyota led the way in most of the centrality indices; thus, the hypothesis was adopted. |
It was confirmed that Toyota Central R&D Labs, Inc. is developing key FCEV technologies, and that the company seeks innovation through the operation of the Core Technology, Strategic Research, and Senior Fellow Laboratory.
To maintain the superiority of the FCEV technology, companies should use the patent data of their partners with a low technology level in the cooperation structure by technology area in evaluating the inventors to identify their technology development capability and to evaluate their cooperation levels. In addition, the South Korean companies hould be able to cooperate with the Japanese companies that have collaborative relationships with Toyota and Honda. Efforts should also be made to trace the history of patent applications of their competitors’ key inventors to identify the retirees and to look for ways of employing the services of the key inventors. The accumulation and utilization of knowledge are important for innovative growth, and the property of knowledge wherein technologies, ideas, and the like are embodied, unlike the traditional production elements like capital and labor, will surely noticeably boost the productivity and generate and spread creative ideas to remarkably improve the social welfare.19) If, in the development of FCEVs, a company develops products equivalent or superior to those of its competitors through low-level technology cooperation, its own technology strength is deemed high, and for continued innovation and development, it is required to strategically transfer its technology to its group affiliates and parts suppliers.20,21 To develop FCEVS, efforts should be made to distinguish between core technologies and non-core technologies so that the non-core technologies can be transferred to the group affiliates and parts suppliers while pouring more efforts and time into the development of core technologies.
4.2 Significance and Limitations of the Study
This study sought to analyze the technologies of individual FCEV parts so as to obtain data on the competitors’ important parts suppliers along with the analysis of their technology, determining the companies with potential cooperation. Deriving new cooperative partners through an analysis of the history of their patent applications, however, was found to have the limitation of skipping the start-ups equipped with R&D capability. In 2015, Toyota disclosed licenses to freely use 3,350 FCEV patents, and has since entered into contracts with applicants for the use of Toyota’s patents. In addition, in 2019, Toyota disclosed 23,740 hybrid technology cases, allowing applicants to use the licenses freely through contracts. Such patent disclosure is very instrumental in exploring start-ups and partners equipped with important technologies. When tracing inventors through the analysis of patents, it was found that the female inventors, if married, had changed their surnames to follow the surnames of their husbands, making it difficult to identify them (Japan, USA, etc.). In the future research, there is a need to reinforce the analysis of the technologies of start-ups that can apply to the FCEV area, and to discuss the method of addressing the problems in tracing inventors. In addition, in analyzing and comparing the FCEVs of the three target companies in this study, there was some limitation in analyzing the specifications of hardware with different application years.
Acknowledgments
A part of this paper was presented at the KSAE 2019 Spring Conference
References
-
K. K. Koo, D. K. Lee, J. C. Hong and S. U. Park, “An Analysis of the Competitiveness of Renewable Energy Technologies,” New & Renewable Energy, Vol.8, No.3, 2012.
[https://doi.org/10.7849/ksnre.2012.8.3.030]

- H. C. Lim, “Prospect and Way to Go for Boosting the H₂ Fuel Cell Industry,” 2015 Annual Spring Meeting of The Korean Society for New and Renewable Energy, p.59, 2015.
- K. S. Yang, Patent Open Innovation Strategy to Expand Fuel Cell Vehicle Market, Kosen Expert Insight, 2017.
-
J. Wang, “Barriers of Scaling-up Fuel Cells: Cost, Durability and Reliability,” Energy, Vol.80, pp.509-521, 2015.
[https://doi.org/10.1016/j.energy.2014.12.007]

- Kakiuchi, Shinji, et al., Car Electronics Transforms Supply Chain; Opportunity to Create Value in Tier-0 and Super Tier-2, Morgan Stanley, 2014.
- M. Romer et al., How Automakers Can Survive the Self-Driving Era, AT Kearney Report, 2016.
-
H. Ernst, “Patent Applications and Subsequent Changes of Performance: Evidence from Timeseries Cross-section Analyses on the Firm Level,” Research Policy, Vol.30, No.1, pp.143-157, 2001.
[https://doi.org/10.1016/S0048-7333(99)00098-0]

-
Pakes and Griliches, The Value of Patents as Indicators of Inventive Activity, National Bureau of Economic Research, Working Paper No.2083, 1986.
[https://doi.org/10.3386/w2083]

-
H. Ernst, “Patenting Strategies in the German Mechanical Engineering Industry and their Relationship to Company Performance,” Technovation, Vol.15, No.4, pp.225-240, 1995.
[https://doi.org/10.1016/0166-4972(95)96605-S]

-
H. Ernst, “Patent Portfolios for Strategic R&D Planning,” Journal of Engineering and Technology Management, Vol.15, No.4, pp.279-308, 1998.
[https://doi.org/10.1016/S0923-4748(98)00018-6]

-
H. Lee, C. Kim, H. Cho and Y. Park, “An ANP-based Technology Network for Identification of Core Technologies: A Case of Telecommunication Technologies,” Expert Systems with Applications, Vol.36, Issue 1, pp.894-908, 2009.
[https://doi.org/10.1016/j.eswa.2007.10.026]

-
C. C. Phelps, “A Longitudinal Study of the Influence of Alliance Network Structure and Composition on Firm Exploratory Innovation,” Academy of Management Journal, Vol.53 No.4, 2010.
[https://doi.org/10.5465/amj.2010.52814627]

-
M. A. Schilling and C. C. Phelps, “Interfirm Collaboration Networks: The Impact of Large-scale Network Structure on Firm Innovation,” Management Science, Vol.53 No.7, 2007.
[https://doi.org/10.1287/mnsc.1060.0624]

-
R. Bekkers and A. Martinelli, “Knowledge Positions in High-tech Markets: Trajectories, Standards, Strategies and True Innovators,” Technological Forecasting and Social Change, Vol.79, Issue 7, pp.1192-1216, 2012.
[https://doi.org/10.1016/j.techfore.2012.01.009]

-
Y. B. You, K. Y. Choi, B. Park and E. S. Jeong, “Technology Trend of Smart Clothing: Based on Patent Information Analysis,” Journal of Digital Contents Society, Vol.13, No.4, pp. 440-451, 2013.
[https://doi.org/10.5392/JKCA.2013.13.04.440]

-
C. H. Ryu, B. S. Joo and M. S. Suh, “A Study on the Intellectual Property Level and Performance of Auto Part Company,” Transactions of KSAE, Vol.26, No.1, pp.52-59, 2018.
[https://doi.org/10.7467/KSAE.2018.26.1.052]

-
Y. B. You, K. Y. Choi, B. Park and E. S. Jeong, “Technology Trend of Smart Clothing: Based on Patent Information Analysis,” The Journal of the Korea Contents Association, Vol.13, No.4, pp.440-451, 2013.
[https://doi.org/10.5392/JKCA.2013.13.04.440]

-
J. H. Park and K. Y. Kwahk, “The Effect of Patent Citation Relationship on Business Performance : A Social Network Analysis Perspective,” Journal of Intelligence and Information Systems, Vol.19, Issue 3, pp.127-139, 2013.
[https://doi.org/10.13088/jiis.2013.19.3.127]

-
P. M. Romer, “Increasing Returns and Long-Run Growth,”Journal of Political Economy, Vol.94, No.5, pp.1002-1037, 1986.
[https://doi.org/10.1086/261420]

- S. K. Yang, S. B. Choi, Y. M. Kim, J. J. Yoon and H. S. Choo, “Vehicle Operation Technology for the Durability of Fuel Cell Stack for FCEV,” KSAE Spring Conference Proceedings, pp.112-114, 2018.
- B. J. Eom, K. M. Lee and M. J. Kim, “Power Distribution Control Strategy and Component’s Variables Optimization on Fuel Cell Electric Vehicle,” KSAE Fall Conference Proceedings, p.656, 2016.
- C. H. Ryu, C. H. Jung and J. W. Bae, “A Study on Patent Analysis of Hydrogen Fuel Cell Vehicle (FCEV),” KSAE Spring Conference Proceedings, p.1304, 2019.

