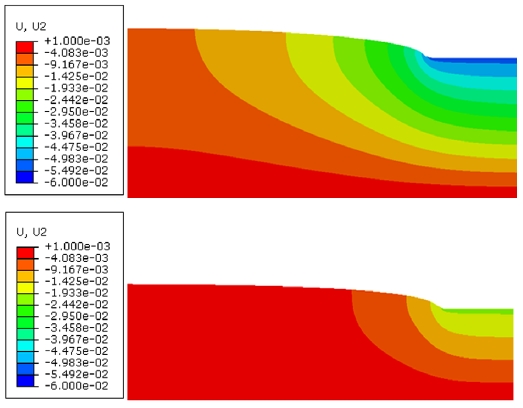
온도와 습도 변동하의 GDL 변형거동 및 피로해석
1)안동대학교 대학원 기계공학과2)안동대학교 기계자동차공학과
2)Department of Automotive & Mechanical Engineering, Andong National University, Gyeongbuk 36729, Korea
Copyright Ⓒ 2019 KSAE / 165-03
This is an Open-Access article distributed under the terms of the Creative Commons Attribution Non-Commercial License(http://creativecommons.org/licenses/by-nc/3.0) which permits unrestricted non-commercial use, distribution, and reproduction in any medium provided the original work is properly cited.
Abstract
Gas diffusion layer(GDL) is a carbon fiber composite with a porous structure. The main roles of GDL include the transfer of reactants, which support the membrane electrode assembly(MEA) where an electrochemical reaction occurs. The porosity of GDL causes non-uniform deformation when subjected to compressive loading during the assembly process, and excessive compressive loading can affect not only the release of reactants and products, but also the deterioration of the structure. In addition, an MEA swelling phenomenon caused by heat and moisture contributes to the non-uniform compression and deterioration in the PEM fuel cell. In this study, the deformation behavior of GDL was studied under the operating conditions of the fuel cell. The effects of GDL thickness and inclusion of MEA in the model were investigated by using a nonlinear orthotropic constitutive model that was coded in the User Material Subroutine(UMAT) of ABAQUS. The properties and relations to represent the hygrothermal behavior of MEA were included in the model by coding them into the User Expansion Subroutine(UEXPAN) of ABAQUS. An idealized 2D plane strain model with symmetric boundary condition was adopted while considering the repeated shape of the fuel cell. In addition to studying GDL deformation behaviors, fatigue analysis was performed to find the effects of thickness and inclusion of MEA on the fatigue life of GDL by comparing the fatigue reserve factor in FE-SAFE.
Keywords:
Fatigue analysis, Finite element analysis, Gas diffusion layer, Membrane electrode assembly, PEMFC, User material subroutine키워드:
피로해석, 유한요소해석, 기체확산층, 막전극 접합체, 고분자 전해질 연료전지, 사용자 재료서브루틴1. 서 론
고분자 전해질 연료전지(PEMFC, proton exchange membrane fuel cell)는 기체확산층(GDL, gas diffusion layer)을 통해 전해질 막의 촉매 층에 공급된 수소와 산소의 화학반응으로 발생한 화학에너지를 전기에너지로 변환시키는 장치로 에너지효율이 내연기관에 비해 높을 뿐만 아니라 소음이 없으며, 친환경적 동력원으로 각광받고 있다.1)
또한 고분자 전해질 연료전지는 에너지를 직접 변환하여 기존에 사용되는 에너지 변환장치에 비해 1.5배 이상의 에너지 효율을 가지며, 변환 시에 물, 전기 그리고 열 이외에는 다른 물질을 배출하지 않는 장점이 있다.2) 그리고 다른 연료전지에 비하여 전류밀도 및 출력밀도가 크고 시동시간이 짧음과 동시에 부하변화에 대한 응답성이 빠르므로 현재 상용화 연구가 빠르게 이루어지고 있다.3) 연료전지의 기체확산층은 분리판(Bipolar plate)을 통하여 연료로 공급되는 수소와 대기 중의 산소를 전기화학반응이 일어나는 막전극 접합체(MEA, membrane electrode assembly)로 전달하고, 전기화학반응으로 인해 생성되는 수분을 배출하는 중요한 역할을 한다. 불규칙한 다공성 구조를 지닌 기체확산층은 연료전지 스택 볼트체결 압축하중으로 인한 불균일한 변형이 발생하며 과도한 변형에 의한 공극체적 손실로 인하여 물질의 이동 흐름을 방해 할 수 있다. 그러므로 최적의 성능을 구현할 수 있는 연료전지 설계는 기체확산층의 정확한 변형거동의 예측을 필요로 한다.
기체확산층은 제작할 때 공정의 특성으로 인하여 하중방향으로 많은 영향을 받게 된다. 기체확산층의 주 재료인 탄소섬유의 불규칙한 다공성 구조는 탄소섬유의 방향과 종방향으로 면내(In-plane)거동에 많은 영향을 준다.4) 고분자 전해질 연료전지의 주요 구성 부품 중 하나인 고분자 전해질 막(PEM, polymer electrode membrane)의 재료는 주로 Nafion이 사용되며, 습도 및 온도의 변화에 따른 수화 및 열 팽창 거동을 보인다.5)
시뮬레이션에서는 실제 연료전지의 작동환경을 고려한 조건을 사용하였다. 즉 온도하중을 포함한 기체확산층, 분리판의 모델을 사용하였으며, 전해질막은 온도, 습도에 의한 하중을 고려하였다. 온도, 습도에 의한 환경조건은 궁극적으로는 연료전지의 파손에 기여하나 실제 작동 조건에서 이의 영향을 평가하는 것은 어려움이 따른다. 그러므로 수치적인 모델에 연료전지의 작동 조건인 수분 및 열 발생을 포함하면 압축하중 상태에서 기체확산층의 변형 형상 및 전해질 막과의 상호 변형의 영향에 대한 해석이 가능할 것이다. 기체확산층의 직교이방성 구성방정식은 상용유한요소해석 프로그램인 ABAQUS의 사용자 재료서브루틴(UMAT)을 이용하여 식을 구현하였으며, 온도와 습도에 의한 전해질 막의 수분 및 열팽창 거동은 ABAQUS의 사용자 서브루틴(UEXPAN)을 사용하여 연구를 진행하였다.
본 연구에서 수행하고자 하는 주 내용은 전해질 막의 수분 및 열팽창의 영향에 대한 기체확산층의 응력분포 및 채널침입 현상을 이해하고 기체확산층의 두께의 변화와 모델내의 전해질 막의 유무에 따른 응력분포 및 피로수명의 확인이며, 이를 통하여 최적의 연료전지 성능 구현 및 기체확산층의 기대수명예측을 하고자 한다. 유한요소해석프로그램은 ABAQUS,6) 피로해석은 FE-SAFE7)를 사용하여 연구를 진행하였다.
2. 구조해석
2.1 유한요소모델
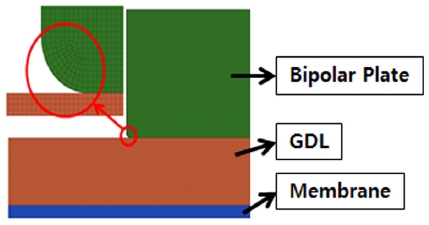
유한요소 모델은 Fig. 1과 같이 기체확산층, 분리판, 전해질 막으로 구성하였다. 유한요소 모델은 해석시간 단축 및 효율적인 해석을 진행하기 위하여 2D평면 변형률모델(2D plane strain model)로 이상화 하였고 대칭성을 고려하여 1/4 모델을 사용하였다.
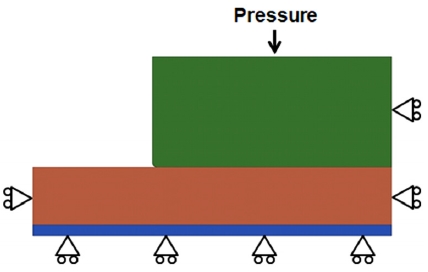
기체확산층은 두께에 따른 변형거동 및 피로해석에 사용할 수 있도록 0.26 mm와 0.1 mm 두께를 지닌 모델로 구성하였다. 유한요소의 크기는 2 μm로 모델링 하였고 ABAQUS에서 제공하는 평면변형요소인 CPE4 요소를 사용하여 Fig. 1과 같이 모델링 하였다. 볼트의 체결력은 균일하게 분포한다고 가정하여 2.0 MPa의 압축하중을 분리판 상부에서 수직방향으로 적용하였다. 기체확산층 및 전해질 막의 적층구조로 인하여 전해질 막 하단부에 X축 대칭조건을 주었으며, 채널 및 랜드부의 반복적인 형상으로 인하여 양쪽 면에 Y축 대칭조건을 부여하여 경계조건을 설정하였다(Fig. 2). 압축하중으로 인한 기체확산층과 분리판 간의 접촉면에 면대면 접촉조건(Surface to surface)을 부여하였고 접촉면간의 접선방향의 거동은 미끄러짐 양이 크지 않기 때문에 소규모 미끄러짐 접촉조건(Small sliding contact)을 사용하였으며, 마찰계수 0.2를 부여하였다.
또한, 볼트체결 후의 연료전지의 작동사이클을 모사한 수분/온도 사이클(Hygrothermal cycle)을 Table 1과 같이 정의하였다. STEP 1, 2, 3는 각각 연료전지의 시동전인 상온상태, 작동시의 수분흡수, 열팽창을 모사하는 최대온도/습도 상태, 작동 후의 원래의 상태인 상온상태의 조건을 나타낸다.
2.2 재료 구성방정식
기체확산층은 제작공정의 특성으로 인한 탄소섬유의 배열 때문에 연속체적 관점으로 보았을 때 직교이방성으로 구현될 수 있다. 또한, 면내 방향에서의 탄소섬유 배열로 인해, 두께방향으로는 쉽게 변형이 일어나는 면내 강성을 지닌 평면 구조물로 가정 될 수 있다. 이러한 변형양상으로 인하여 두께 방향으로 변형률에 따른 비선형 탄성계수를 사용한 Garcia-Salaberri 등8)의 거시적 직교이방성모델을 사용하였고 열팽창에 의한 변형을 포함하였다. 모델에 사용한 두께방향의 탄성계수는 Table 2와 같이 변형률의 함수로 나타내었다. 또한, 체결압축 시에 측방향의 변형은 기체확산층의 다공특성과 탄소섬유의 높은 강성에 의하여 기공부피만 감소하므로 포아송비는 0으로 가정하였다.8) 수치모델에 사용한 기체확산층의 재료는 Toray TGP-H-060이며 기계적 물성치는 Table 3에 나타내었다.
전해질 막은 연료전지의 주요 부품 중 하나이며, 연료전지의 체결구조 또는 기체확산층의 재료 물성에 따라 응력분포 및 변형 형상이 크게 달라진다. 전해질 막 수치모델에 사용한 재료는 Nafion 112이며 기계적 거동은 탄성-완전소성을 가정하였고 수분/온도(Hygrothermal behavior)거동 특성을 포함하였다. 수분과 온도변화에 대한 전해질 막의 변형계수 α΄을 식 (1)과 같이 팽윤(Swelling)과 열팽창에 의한 영향을 조합하여 나타내었다. 여기서 α는 열팽창계수이며, β는 팽윤계수이다.9)
| α'(T,RH)=[1+α(T)ΔT][1+β(RH,T)ΔRH(T)]-1ΔT | (1) |
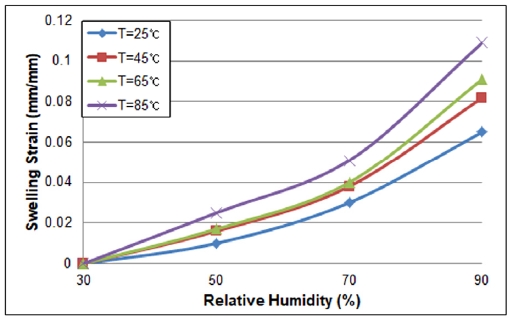
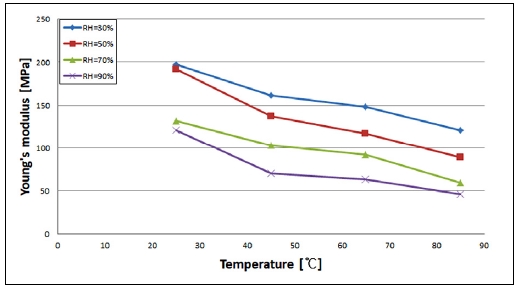
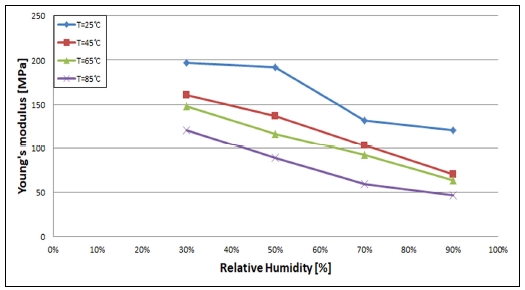
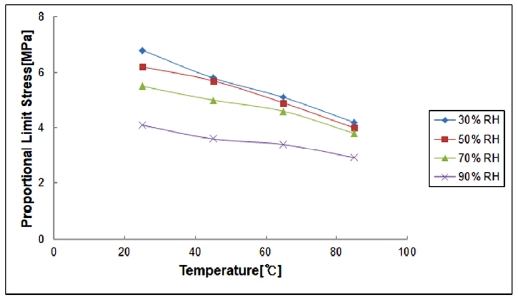
ABAQUS의 서브루틴인 UEXPAN에 Fig. 3의 팽윤변형률(Swelling strain)과 Table 4의 물성치를 사용하여 수분 및 온도 변화로 인한 변형계수 식 (1)을 코딩하였다. 전해질 막의 탄성계수는 온도 및 습도에 따라 최대 197 MPa에서 최소 46 MPa까지 변화되며, 항복응력 및 소성영역의 거동 또한 온도 및 습도에 영향을 받아 크게 변화된다(Fig. 4, 5, 6).
탄성-완전소성으로 가정한 전해질막의 항복점 정의는 항복점의 비선형 특성 때문에 비례한도 응력을 사용하여 정의하였다(Fig. 6). 온도 및 습도의 변화에 대한 항복점의 실험 데이터를 모사에 적용하였으며 작용하중 방향을 고려해 횡방향의 결과를 사용하였다. 분리판의 기계적 거동은 등방성을 가정하였다.
2.3 유한요소해석 결과
본 연구에서는 작동온도, 습도를 고려한 단순화된 연료전지 유한 요소모델을 사용하여 기체확산층의 변형거동을 해석하였으며 다른 두께를 지닌 기체확산층(0.26 mm, 0.1 mm)모델을 사용하고 전해질 막 유/무에 따른 기체확산층의 변형양상을 최대주응력 및 채널침입량, 변위변화에 대한 차이를 비교하여 확인하였다.
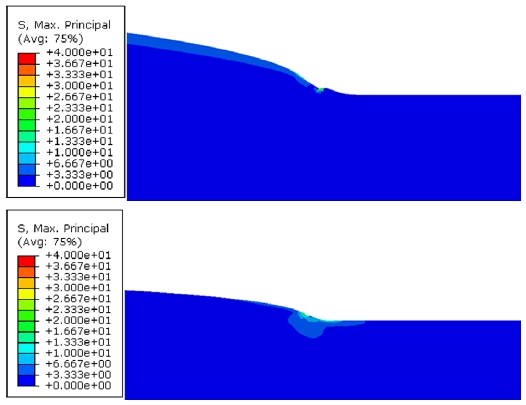
먼저 온/습도를 적용한 기체확산층의 두께에 따른 영향을 확인하였다. 기체확산층의 두께가 증가할수록 최대주응력은 증가 하였으며 최대주응력의 발생 위치는 분리판 모서리부분과의 접촉 부위이다(Table 5, Fig. 7, 8).
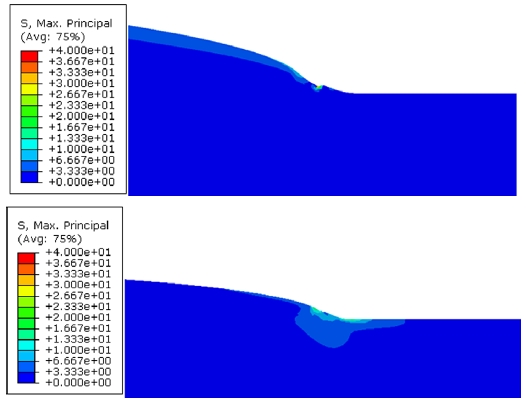
Contour plots of the GDL max principal stress distribution with membrane (top: 0.26 mm, bottom: 0.1 mm)
전해질 막의 수분 및 열에 의한 변형은 기체확산층의 변형에 영향을 주어서 최대주응력은 전해질 막을 포함한 모델에서 증가함을 관찰할 수 있었다(Table 5).
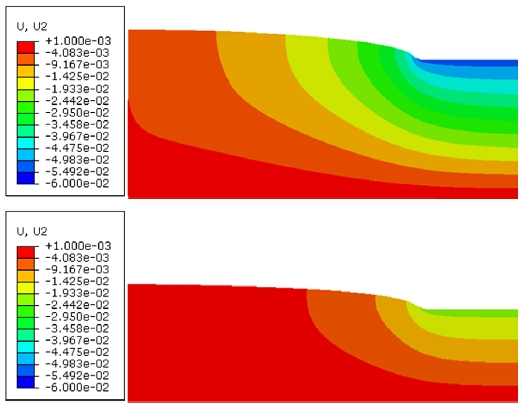
채널침입량의 경우도 응력과 마찬가지로 기체확산층의 두께에 비례하여 증가하였다(Table 6, Fig. 9, 10). 채널침입량의 경우 측정을 할 때 같은 높이를 기준으로 가장 높은 부분에서 가장 낮은 부분을 측정하였다. 응력의 경우와 마찬가지로 전해질 막의 수분 및 열에 의한 변형은 기체확산층의 변형에 영향을 주어서 채널침입량도 전해질 막을 포함한 모델에서 더 큰 값을 관찰할 수 있었다(Table 6).
3. 피로해석
피로해석은 대상의 특성을 고려하여 응력-수명 선도, 변형률-수명 선도 중에 선택하게 된다.11)
본 연구에서는 상용 피로해석프로그램인 FE-SAFE를 사용하여 연료전지 작동 구간에서의 최대 온도와 습도상태에서의 응력과 상온상태의 온/습도에서의 응력 결과를 사용하여 피로수명을 계산하였다. 온도와 습도에 대한 전해질 막의 수분 및 열팽창으로 인하여 발생되는 영향이 기체확산층에 영향을 준다는 것을 유한요소해석결과를 통해 확인하였다. 이러한 전해질막의 반복적인 팽/압축 현상은 볼트에 의한 압축에 의한 제한 때문에 전해질막과 접촉한 기체확산층에도 면내방향으로의 인장/압축 하중을 발생시킨다. 또한 연료전지를 조립할 때 발생하는 체결하중으로 인하여 기체확산층은 높은 평균응력 상태를 지닌다.
FE-SAFE에서 피로안전도를 판단하는 피로안전계수인 FRF(Fatigue Reserve Factor)를 사용하여 피로해석을 진행하였고 사용된 피로 물성값은 Table 7에 제시하였다.
| Fatigue Reserve Factor=AB | (2) |
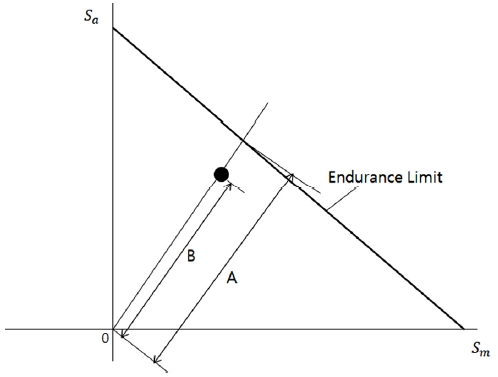
교통수단에 쓰이는 연료전지의 시간당 작동 사이클수는 150 사이클 정도이고, 요구수명은 5,000~35,000 시간이다. 요구수명을 사이클수로 변환하면 75만에서 525만 사이클 정도를 필요로 한다.14) 피로안전계수 계산을 위한 Goodman 선도의 극한 인장강도 값 (Sm)은 220 MPa, 피로한도 값 (Sa)은 117 MPa 을 설정하였고, Fig. 11와 같이 피로한도선(Endurance limit line)을 나타내었다. 극한인장강도는 가장 보수적인 수치를 사용하였고13) 피로한도값 117 MPa 에 대한 반복 사이클 수 (4.5×10⁹)가 교통수단에 쓰이는 연료전지의 최대 요구수명 사이클수인 525만 사이클보다 큰 값이므로 이를 피로한도값으로 가정하여 사용하였다. FE-SAFE에서는 식 (2)를 이용하여 반경 방향으로의 상대적인 비율로 FRF 값이 계산된다.7)
3.1 피로해석 결과
기존의 피로해석이론은 주로 금속재에 대해서 제안되었으며 본 연구의 재료인 얇은 박막형태의 탄소종이인 기체확산층은 피로물성값의 측정도 어려울 뿐 아니라 기존 피로이론의 적용여부도 불확실한 상태이다. 그러므로 절대적인 피로안전계수 결정이 아닌 상대적인 설계방향에 대한 평가를 목적으로 기존의 피로해석방법을 수행하였다. 유한요소해석을 통해 얻은 응력 결과값을 사용한 응력기반 피로해석을 진행하였으며, 설계수명을 무한수명으로 설정하여 최대온도/습도와 상온/습도를 반복하는 Cycle을 통해 피로안전계수를 구하여 피로수명을 예측하였다.
유한요소해석 결과 응력값은 Goodman 선도의 내구한도선(Endurance limit) 안쪽에 위치하여 피로안전계수는 매우 높은 값을 나타내었다. 높은 응력을 보였던 분리판과의 접촉부에서 가장 낮은 FRF값을 관찰할 수 있었으며 기체확산층의 두께와 전해질 막의 유무에 따른 FRF값을 Table 8에 비교하였다. 평균응력이 커질수록 피로안전계수값은 감소하였으며 온/습도에 의한 변동응력의 영향은 상대적으로 적었다. 또한, 전해질 막의 유무는 기체확산층의 변형 거동에 영향을 주어 전해질 막을 포함한 모델이 상대적으로 낮은 피로안전계수를 보였다.
4. 결 론
기체확산층의 직교이방성 모델을 이용하여 변형거동을 연구하였다. 기체확산층의 변형에 대한 전해질 막의 영향을 확인하였으며 기체확산층의 두께의 변화에 따른 응력 및 피로안전계수를 계산하여 그 영향을 나타내었다. 본 연구에서는 다음과 같은 결론을 도출하였다.
- 1) 전해질 막이 존재하는 모델의 경우 온도/수분에 의한 팽창에 의하여 기체확산층 변형에 영향을 주어서 기체확산층 응력이 증가됨을 확인하였다.
- 2) 0.26 mm 두께를 지닌 GDL이 0.1 mm 인 경우보다 상대적으로 높은 응력과 채널침입량을 보였으며 이는 두께에 비례해서 기체확산층에서의 굽힘응력이 증가하기 때문이라 사료된다.
- 3) 두꺼운 두께를 지닌 기체확산층이 상대적으로 낮은 피로안전계수를 나타내었으며 전해질 막을 사용하지 않은 모델이 사용한 모델보다 상대적으로 높은 피로안전계수를 나타내었다.
- 4) 이러한 수치해석의 결과를 이용하여 기체확산층의 두께 조절과 전해질 막의 물성 및 물리적 특성 조절을 통하여 기체확산층의 피로파손에 대한 예측과 내구성에 대한 최적화가 가능할 것으로 판단된다.
Acknowledgments
이 논문은 2018학년도 안동대학교 학술연구조성비에 의하여 연구되었음.
References
-
C. J. Oh, and Y. T. Lee, “Measurement of In-plane Gas Permeability of Gas Diffusion Layers in Proton Exchange Membrane Fuel Cells Under Compressive Strain”, Korean Journal of Air-Conditioning and Refrigeration Engineering, 28(9), p367-372, (2016).
[https://doi.org/10.6110/kjacr.2016.28.9.367]

-
B. J. Kim, and S. J. Park, “Influence of Activation of Mesoporous Carbon on Electrochemical Behaviors of Pt-Ru Nanoparticle Catalysts for PEMFCs”, Polymer(Korea), 35(1), p35-39, (2011).
[https://doi.org/10.7317/pk.2011.35.1.35]

-
S. W. Yoon, D. H. Kim, B. S. Lee, B. S. Lee, G. Y. Moon, H. S. Byun, and J. W. Rhim, “Preparation and Characterization of PVA/PAM Electrolyte Membranes Containing Silica Compounds for Direct Methanol Fuel Cell Application”, Polymer(Korea), 34(1), p45-51, (2010).
[https://doi.org/10.7317/pk.2010.34.1.45]

-
T. H. Lee, and C. H. Yang, “A Study on the Design Parameters Affecting GDL Deformation Behavior”, Transactions of KSAE, 26(6), p764-772, (2018).
[https://doi.org/10.7467/ksae.2018.26.6.764]

-
J. H. Yang, and J. S. Park, “Study for the Deformation and Fatigue Life of a PEMFC”, Journal of the Korean Society for Aeronautical & Space Sciences, 39(5), p400-407, (2011).
[https://doi.org/10.5139/jksas.2011.39.5.400]

- ABAQUS Users Manual, Ver.6.4, HKS, (2003).
- FE-SAFE Users Guide, Ver.2018, Dassault Systems, (2018).
- P. A. Garcia-Salaberri, M. Vera, and R. Zaera, “Nonlinear Orthotropic Model of the Inhomogeneous Assembly Compression of PEM Fuel Cell Gas Diffusion Layer”, International Journal of Hydrogen Energy, 36(18), p11856-11870, (2011).
-
Y. Zhou, G. Lin, A. J. Shih, and S. J. Hu, “Assembly Pressure and Membrane Swelling in PEM Fuel Cells”, Journal of Power Sources, 192(2), p544-551, (2009).
[https://doi.org/10.1016/j.jpowsour.2009.01.085]

-
Y. Tang, A. M. Karlsson, M. H. Santare, M. Gillbert, S. Cleghorn, and W. B. Johnson, “An Experimental Investigation of Humidity and Temperature Effects on the Mechanical Properties of Perfluorosulfonic Acid Membrane”, Materials Science and Engineering: A, 425, p297-304, (2006).
[https://doi.org/10.1016/j.msea.2006.03.055]

- S. Y. Kim, S. S. Kweon, D. K. Park, D. W. Chun, and I. S. Chung, “Durability Test and Fatigue Analysis of Independent Suspension Knuckle for Commercial Vehicle”, KSAE Spring Conference Proceeding, p1005-1010, (2011).
- G. M. D. Almaraz, J. A. R. Vilchez, A. Dominguez, and Y. Meyer, “Ultrasonic Fatigue Endurance of Thin Carbon Fiber Sheets”, Metallurgical and Materials Transactions A, 47(4), p1654-1660, (2016).
-
X. Zhang, and Z. Shen, “Carbon Fiber Paper for Fuel Cell Electrode”, Fuel, 81(17), p2199-2201, (2002).
[https://doi.org/10.1016/s0016-2361(02)00166-7]

- V. Atrazhev, T. Astakhova, D. Dmitriev, N. Erikhman, V. Sultanov, T. Patterson, and S. Burlatsky, “The Model of Stress Distribution in Polymer Electrolyte Membrane”, Journal of The Electrochemical Society, 160(10), pF1129-F1137, (2013).

