1/4 스케일 버스 모델의 지면효과에 관한 풍동시험 및 해석
*This is an Open-Access article distributed under the terms of the Creative Commons Attribution Non-Commercial License(http://creativecommons.org/licenses/by-nc/3.0) which permits unrestricted non-commercial use, distribution, and reproduction in any medium provided the original work is properly cited.
Abstract
The effect of moving ground and wheel rotation on the aerodynamic characteristics of a commercial bus was examined experimentally, as well as numerically. Wind tunnel tests were conducted by using a 1/4 scale model whose length was 3.008 m and width was 0.624 m running at a speed of 160 m/s, thus producing a Reynolds number per unit length of 0.8×10⁶. Simulations were performed by using PowerFLOW, a Lattice Boltzmann-based method. The simulated boundary layer profile and extensive surface pressure prediction worked well with the test results. It was found that when comparing the simulation results for a scale model with those in the experiment, the differences were less than 2.5 %. The results clearly showed that the absolute magnitudes of the measured drag and surface pressure on the rear body changed significantly when moving ground and wheel rotation were utilized.
Keywords:
Moving ground, Scale model, Commercial bus, Aerodynamics, Surface pressure, Boundary layer, Wind tunnel키워드:
이동지면, 스케일 모델, 상용버스, 공기역학, 표면 압력, 경계층, 풍동1. 서 론
고속버스는 승객운송을 목적으로 장거리를 고속 운행하므로 고속 주행시 공기저항 최소화를 통한 연비효율 향상은 고속버스 상품성의 매우 중요한 요소이며 최근 환경 문제의 대두로 연비 효율 극대화를 위해 고속버스 저항력 형상 설계에 대한 많은 연구들이 진행되고 있다.1-6) 고속버스의 경우 차체 전방 좌우에 위치하는 대형 미러, 루프 상면의 공조 시스템, 차체하부의 복잡한 형상, 회전하는 대형 휠등으로 차체주위 및 차체 하부의 공기흐름은 복잡한 난류유동을 형성하게 된다. 고속버스는 승용차에 비해 투영 면적이 상대적으로 매우 크며 이로 인해 후류 또한 크게 형성된다. 따라서 이러한 후류구조를 정확이 예측하여 유도저항을 최소화 하는 것이 공기역학적 버스 형상 설계의 관건이다. 상용버스 후류는 무딘 물체 후미에서 전형적으로 발생하는 올려 흐름이 형성되며 흐름의 크기 및 중심점의 위치에 따라 후면 압력 회복과 후류 구조에 영향을 미치게 된다.
차체 하부를 지난 올려 흐름은 긴 차체 하부에서 발생하는 복잡한 난류 유동의 영향을 받으며 앞서 언급한 바와 같이 전반적인 후류 구조에 영향을 주기 때문에 긴 차체 하부와 지면 사이에서 발생하는 흐름 모사가 매우 중요하다. 이를 위해서는 지면 효과 및 회전에 의한 휠 효과를 정확히 고려해야 되며 고속 주행시 실도로 조건을 재현하기 위한 가장 중요한 요소이다. 최근까지 휠 회전 및 이동지면 조건이 자동차 공력에 미치는 영향에 대해 많은 연구들이 이루어져 왔으나 큰 휠과 긴 차체 그리고 복잡한 하부 형상을 갖는 상용 버스에 대한 연구는 미진한 실정이다. 지금까지의 연구들은 지극히 단순화된 버스형상을 대상으로 수행되었고 실차와 유사한 바디 형상을 이용하더라도 바디 하부를 단순화하여 진행된 연구들이 대부분이다.7-9) 따라서 고속버스의 공기역학적 특성을 이해하고 개선하기 위해서는 휠회전과 지면효과를 고찰하는 것이 필수적이며 이를 통해 항력 저감 설계 및 공력 최적화 설계를 도모할 수 있을 것이다.
최근 승용차에 대한 연구들은 지면 고정 조건 보다 휠 회전과 지면 이동 조건에서 공기저항이 보다 작게 발생함을 보여주고 있다.10-12) 고속버스의 경우 후륜에 복수개의 휠이 장착되어 있고 차체 하부 흐름이 더욱 복잡하여 고정지면 조건에 비해 휠 회전 및 지면이동 조건에서 항력은 더욱 크게 발생할 것으로 판단되나 이를 뒷받침할 만한 시험 및 해석적 연구는 매우 미흡하다.
본 연구에서는 대형버스 1/4 스케일 모델을 이용하여 휠 회전 및 지면 효과를 고찰하였다. 풍동시험 시 표면 압력계수, 빈 풍동 지면 경계층, 지면 조건 변경에 따른 항력계수를 계측하여 이를 해석결과와 비교 분석하였다.
2. 해 석
본 연구에서는 Exa사에서 개발한 상용 프로그램인 PowerFLOW S/W를 이용하였다. 디지털 물리학에 기초한 전산유체역학 코드로서 Lattice Boltzmann Method(이하 LBM)을 근간으로 한 유동 입자의 이송 및 충돌에 의한 상호 작용 관계를 구현한다. 상기 코드는 수치적 소산이 매우 적은 미시적인 유동구조를 모사하기 위해서 질량과 운동량의 실제적인 이송을 다루는 이상 기체 방정식과 LBM을 연성하여 해를 구하는 방식을 채택하고 있다. 따라서 기존의 이산화된 편미분 방정식을 활용한 범용코드에 비해 시간변화에 따른 미시적인 유동구조를 잘 모사하는 장점이 있다.13,14)
수치모사를 통해 횔 회전 효과를 재현하기 위해서는 횔 회전 모델링이 관건이며 지금까지 알려진 휠 회전 모델링 방법은 다음과 같다. Rotating wall boundary 조건은 회전체의 표면에 접선 속도를 직접 정의하는 것으로 일반적인 공력 해석시 사용되는 방법이나 횔 내측 회전 영역의 회전 효과를 고려할 수 없는 단점이 있다. 팬 회전 모델링에 흔히 사용되는 MRF(Multiple reference frame) 기법은 축대칭 유동장 해석을 위해 개발된 기법으로 회전하는 휠과 같은 축대칭 유동이 아닌 경우 휠 주위 압력장 예측에 무리가 있다. LRF sliding mesh 기법은 회전 영역 격자계를 실제로 회전시키는 것으로 계산시간이 증가하나 물리적으로 휠 회전 유동을 고려하기 위한 가장 타당한 방법이며 본 연구에서는 이 방법을 채택하였다.
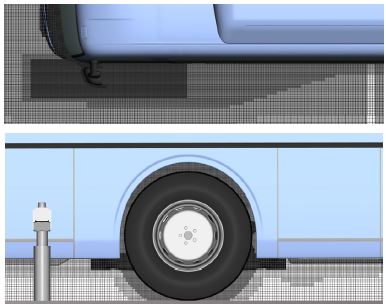
Fig. 1에는 A-pillar 및 휠 영역의 볼륨 격자를 도시하였다. 최소격자는 0.3125 mm이며 프런트 바디 A-pillar 영역과 측면 곡률부에 적용하였고 이외에 프런트 및 리어바디 곡률부는 전체적으로 0.625 mm의 크기로 휠 영역은 1.25 mm로 하였다. 전체 볼륨 격자는 약 2억 개이며 80만 번의 반복계산을 하였다.
3. 풍동시험
3.1 스케일 모델 제작
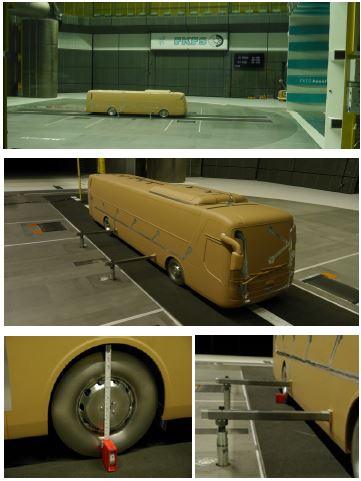
1/4 스케일 모델의 전장은 약 3 m이며 구체적인 제원은 Table 1과 같으며 Fig. 2에는 테스트 섹션에 놓인 스케일 모델을 도시하였다. 풍동 시험시 고속의 주행풍으로 인한 진동을 방지하고 내구성을 확보하기 위하여 고강도 프레임을 설계하여 모델 내부에 삽입하였고 고속에서의 요잉 및 피칭을 방지하기 위해 모델이 지면과 고정되도록 지지대를 제작하였다. 휠은 알루미늄 재질로 제작하였으며 지면과 접촉하는 면에는 고무를 코팅하였다. 휠과 회전축 내측에는 초정밀 베어링을 사용하여 휠 회전 시 구름저항을 최소화 하였다.
3.2 실도로 조건 재현
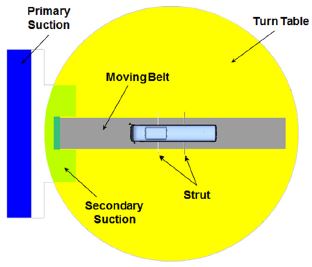
풍동시험은 독일의 Stuttgart에 위치한 FKFS(Forschungsinstitut für Kraftfahrwesen und Fahrzeugmotoren Stuttgart) 실차 풍동에서 수행되었다. Fig. 3에서 도시한 바와 같이 FKFS 풍동은 차량의 하부 영역에서 벨트를 이용하여 지면 이동 조건 재현이 가능하며 지면에서 발생하는 경계층이 항력에 미치는 영향을 최소화하기 위해 풍동 입구와 차량 전방부에 흡입영역이 설치되어 있다. 시험이 수행된 FKFS 실차 풍동의 대략적인 제원은 Table 2와 같다.
4. 풍동시험 및 해석결과 비교
4.1 빈 풍동 지면 경계층 모사
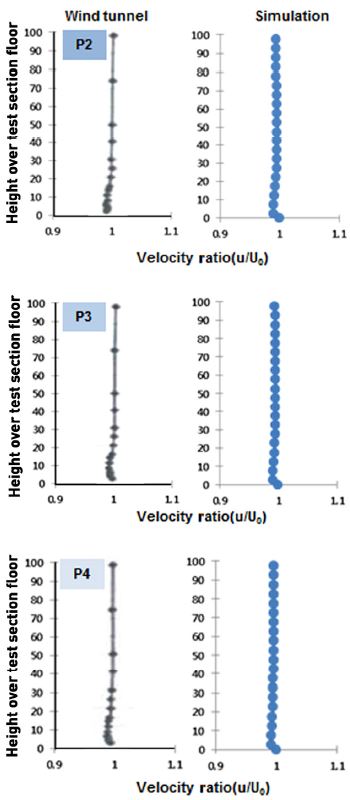
지면 경계층 모사를 위해 경계층 제어장치 및 무빙벨트를 모델링하고 고정지면과 실도로 조건 각각에 대해 빈 풍동 해석을 수행하였다. 빈 풍동 상태에서 측정된 지면 경계층 프로파일15)을 토대로 반복 계산을 통해 경계층 제어를 위한 흡입량을 결정하였다. 풍동 지면 각 지점에서 지면 조건 변화에 따른 빈 풍동 시험 결과와 해석결과는 Fig. 4와 Fig. 5에 도시한 바와 같이 해석결과가 실제 풍동의 지면 경계층을 잘 모사하고 있음을 확인할 수 있다.
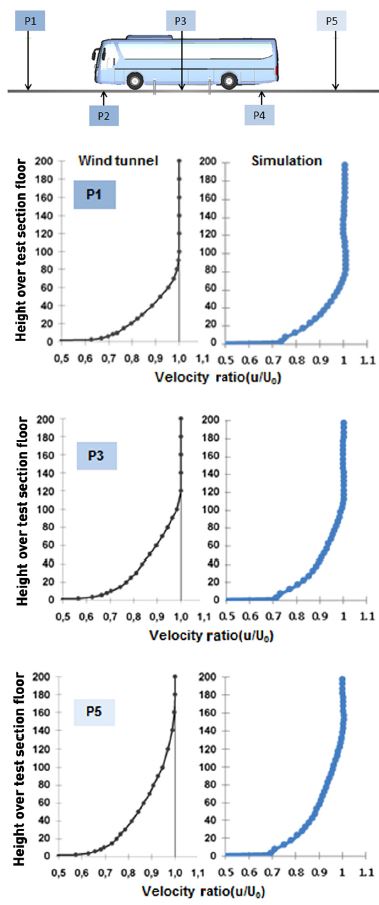
Comparison of boundary layer profile at different positions along the moving belt centerline (static ground)
4.2 표면 압력 분포
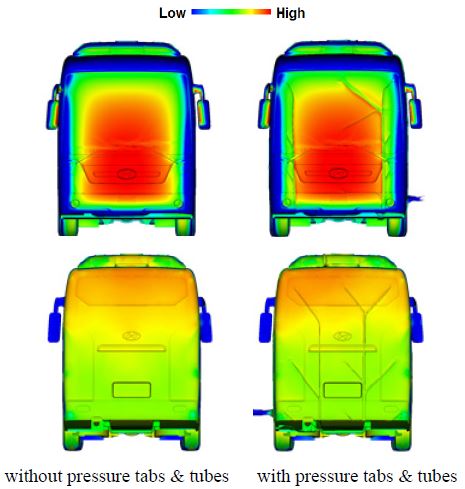
휠 및 지면 이동 조건에서 측정된 표면 압력계수를 Fig. 6에 도시하였다. 해석과 시험결과의 경향성이 전반적으로 잘 일치하는 것을 확인할 수 있었다. 다수의 압력 탭과 튜브 등이 전면에 부착되어 있어 이 영향으로 바디 측면과 후면 몇 지점에서 압력값은 차이를 나타내고 있다. 압력탭과 튜브의 영향을 파악하기 위하여 압력탭과 튜부가 장착된 모델의 스캔 과정을 거쳐 이 형상을 해석 모델에 반영하였다.
압력 탭과 튜브 형상이 없는 모델의 측면과 후면에서 큰 차이를 보이는 압력 값들은 압력 탭과 튜브형상을 반영할 때 시험 결과와 보다 유사한 값을 얻을 수 있었다. Fig. 7과 같이 압력 탭과 튜브 형상 고려시 국부적으로 압력분포가 차이가 남을 볼 수 있으며 압력 탭과 압력 탭에 연결되는 튜브 다발이 결과에 영향을 미치는 것으로 사료된다.
또한, 압력 탭과 튜브 형상 유무에 따른 항력 차이는 0.2 % 내외로 압력 탭과 튜브 형상이 항력에 미치는 영향은 매우 작음을 알 수 있었다.
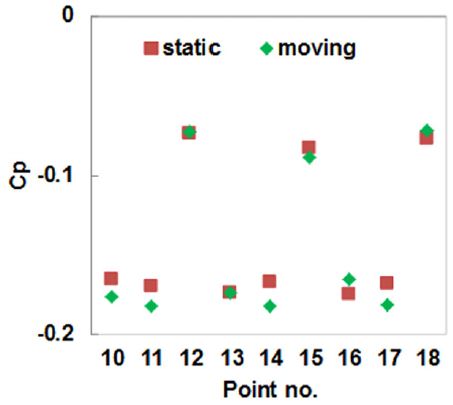
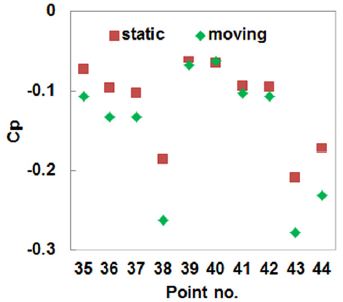
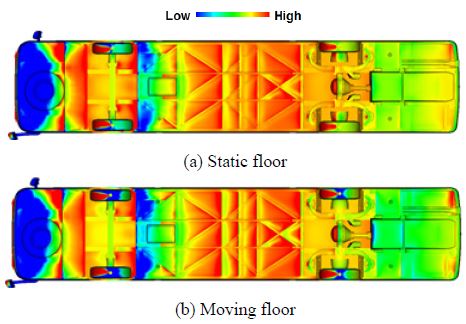
Fig. 8과 Fig. 9는 지면 조건 변경에 따른 압력계수 측정 결과를 나타내었다. 바디 후면의 압력계수는 전체적으로 음의 값을 갖으며 하단 및 중앙영역보다는 상단영역에서 압력회복이 보다 크게 발생하고 있다. 지면 이동 조건 고려시 바디 후면 압력은 전반적으로 압력회복에 불리하며 고정지면 대비 항력 증가를 유추해 볼 수 있다. 바디 하부면의 압력은 지면 이동 조건 적용시 전반적으로 음압이 증가하였고 바디 후미 영역에서 보다 급격하게 증가하였으며 Fig. 10의 엔진룸 하부 압력분포 해석결과도 동일한 경향을 나타내고 있다.
4.3 공기저항
지면 조건 변화에 따른 해석과 풍동시험 결과를 Fig. 11에 도시하였다. 휠 회전 및 지면 이동조건 풍동시험 결과 고정지면 조건 대비 약 9.5 % 항력이 증가하였다. 고정지면 조건에서는 해석과 시험의 차이가 0.1 % 미만이며 지면 이동 조건에서는 2.5 % 차이를 나타내었다. 횡풍 조건에서도 시험결과와 해석결과가 2 % 이내로 잘 일치하고 있다.
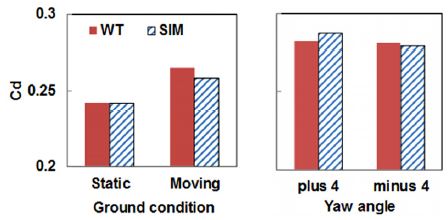
Comparison of drag coefficient according to the variation of ground condition and yaw angle (left: for zero yaw, right: for moving floor)
Fig. 12에 도시한 모델은 후류의 구조가 변화되어 바디 후면 압력이 크게 증가 또는 감소하는 모델과 지상고가 축소된 모델이다. 모델 A와 B는 각각 리어 바디 형상이 변경(상단 및 측면 경사각 적용)된 모델이고 모델 C는 기준모델 리어바디 상단에 루프 스포일러가 장착된 모델이며 모델 D는 모델 B의 지상고를 4 mm 감소한 모델이다. 후류 변화에 의한 바디 후면 압력이 크게 차이나는 모델에 대해서도 전반적으로 약 2 % 이내로 해석과 시험 결과가 잘 일치하고 있음을 확인하였다.
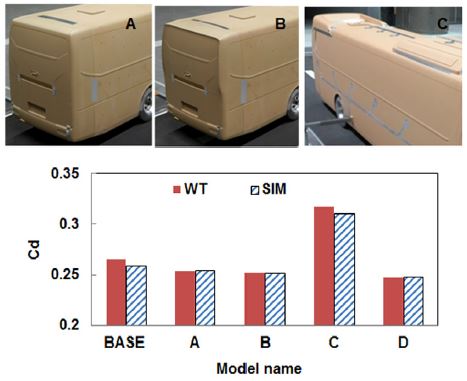
Comparison of drag coefficient for different rear end shape and ground clearance under moving floor condition
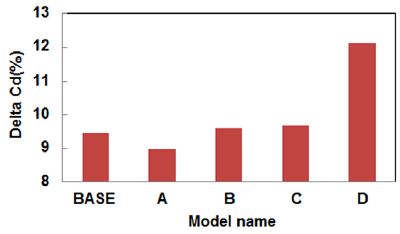
Fig. 13에는 고정지면 대비 지면이동 조건 적용시 각 모델의 항력 증가율에 대한 시험결과를 도시하였다. 후미 형상변경에 따른 항력은 지면조건 적용으로 전반적으로 9 % ~ 9.7 % 증가하였고 지상고를 축소한 경우 12.1 % 증가하였다. 지상고를 축소한 모델 D는 다른 모델에 비해 지면 조건 적용에 따른 항력 증가율이 2 % 이상 더 증가함을 볼 수 있다. 따라서 지상고가 변경되는 경우 휠 회전과 지면 조건이 상대적으로 보다 크게 영향을 미치고 있음을 확인할 수 있으며 지상고가 변경되는 모델의 항력 효과 고찰시 휠 회전 및 지면이동 조건을 고려해야 정성적인 측면뿐만 아니라 정량적으로도 보다 정확한 항력 결과를 얻을 수 있음을 알 수 있었다.
5. 결 론
본 연구에서는 대형버스 1/4 스케일 모델을 이용하여 휠 회전 및 지면 효과를 고찰하였다. 풍동시험을 통해 표면 압력계수 및 빈 풍동 지면 경계층 계측, 지면 조건 변경에 따른 항력계수를 평가하여 이를 해석결과와 비교 분석하였으며 본 연구를 통해 다음과 같은 결론을 얻었다.
- 1) 1/4 스케일 모델을 활용한 지면 이동 재현 풍동 시험결과와 해석결과 비교시 공기저항은 정풍 및 횡풍 조건에서 약 2.5 % 이내의 차이를 보여 매우 잘 일치하는 결과를 나타내었다.
- 2) 지면 경계층 모사를 위해 경계층 제어장치 및 무빙벨트를 모델링하고 고정지면과 실도로 조건 각각에 대해 빈풍동 해석을 수행한 결과 해석결과가 실제 풍동의 지면 경계층을 잘 모사하고 있음을 확인하였다.
- 3) 압력 탭 및 튜브 형상 모델링을 고려할 때 시험결과와 보다 유사한 표면 압력 계수 예측이 가능하였고 압력 탭과 튜브 형상 유무에 따른 전체 항력 차이는 0.2 % 내외로 압력 탭과 튜브 형상이 항력에 미치는 영향은 매우 작음을 알 수 있었다.
- 4) 휠 회전 및 지면 효과를 고려시 버스 바디 후면 압력은 전반적으로 압력회복에 불리하며 고정지면 대비 항력이 약 9.5 % 증가하였다.
References
-
A. Raveendran, S. N. Sridhara, D. Rakesh, and S. R. Shankapal, “Exterior Styling of an Intercity Transport Bus for Improved Aerodynamic Performance”, SAE 2009-28-0060, (2009).
[https://doi.org/10.4271/2009-28-0060]

-
V. T. Shekar, A. Thuraimoni, S. Reddy, and A. Cherukuri, “A Holistic Approach to Aerodynamics of Intercity and Interurban Buses”, SAE 2014-01-0581, (2014).
[https://doi.org/10.4271/2014-01-0581]

-
M. Juhlin, and P. Eriksson, “A Vehicle Parameter Study on Crosswind Sensitivity of Buses”, SAE 2004-01-2612, (2004).
[https://doi.org/10.4271/2004-01-2612]

-
C. H. Kim, and S. H. Lee, “An Experimental Study on the Aerodynamic Characteristics of a Streamline-designed High-speed Bus”, Transactions of KSAE, 24(2), p198-204, (2016).
[https://doi.org/10.7467/ksae.2016.24.2.198]

- J. H. Kwon, D. Y. Shim, and C. H. Kim, “A Numerical Study on the Aerodynamic Effect of a Streamlined Design of a High-speed Long-distance Bus”, KSAE Spring Conference Proceedings, p1499, (2013).
- C. H. Kim, S. I. Lee, J. H. Park, and D. K. Kim, “A Study on the Aerodynamic Design of a High-speed Bus for the Induced Drag Reduction”, KSAE Annual Conference Proceedings, p392-394, (2013).
-
M. Tanimura, Y. Kato, and S. Kato, “Optimization of Under-Floor Flows to Aim at Drag and Lift Compatible Reduction of Large Commercial Vehicles Control of Flow Fields Around Wheels”, JSAE 2005-08-0326, (2005).
[https://doi.org/10.4271/2005-08-0326]

- Y. Kato, S. Kato, and K. Yamamoto, “Optimization Control of Wake and Under-Floor Flow for Compatible Reduction of Large Commercial Vehicles”, JSAE 2003-08-0159, (2003).
- K. Yamamoto, S. Kato, Y. Kaya, T. Mizutani, and Y. Kato, “Under-floor Flow Optimization for Minimizing the Drag of Large Commercial Vehicles”, JSAE 2002-08-0080, (2002).
-
G. Wickern, K. Zwicker, and M. Pfadenhauer, “Rotating Wheels - Their Impact on Wind Tunnel Test Techniques and on Vehicle Drag Results”, SAE 970133, (1997).
[https://doi.org/10.4271/970133]

-
P. Elofsson, and M. Bannister, “Drag Reduction Mechanism Due to Moving Ground and Wheel Rotation in Passenger Cars”, SAE 2002-01-0531, (2002).
[https://doi.org/10.4271/2002-01-0531]

- C. Landstrom, and L. Lofdahl, “Detailed Flow Studies in Close Proximity of Rotating Wheels on a Passenger Car”, SAE International Journal of Passenger Cars - Mechanical Systems, 2(1), p861-874, (2009).
- C. Teixeria, Continuum Limit of Lattice Gas Fluid Dynamics, Ph. D. Dissertation, MIT, Cambridge, (1992).
-
R. Lietz, S. Mallick, S. Kandasamy, and H. Chen, “Exterior Airflow Simulations Using a Lattice Boltzman Approach”, SAE 2002-01-0596, (2002).
[https://doi.org/10.4271/2002-01-0596]

-
R. Blurnrich, N. Widdecke, J. Wiedemann, A. Michelbach, F. Wittmeier, and O. Beland, “New FKFS Technology at the Full-Scale Aeroacoustic Wind Tunnel of University of Stuttgart”, SAE 2015-01-1557, (2015).
[https://doi.org/10.4271/2015-01-1557]

